Fig. 1.
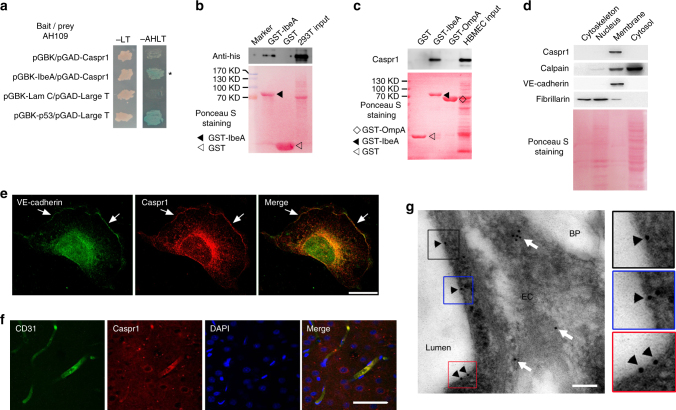
Endothelial Caspr1 is identified as the binding protein of bacterial IbeA. a Yeast cells co-transformed with bait and prey plasmids were grown on SD/-Leu-Trp (-LT) selection medium and SD/-Ade-His-Leu-Trp (-AHLT) medium containing X-α-Gal. Co-transformation of Lamin C and Large T served as a negative control, whereas p53 and Large T was a positive control. b HEK293T cells were transfected with His-tagged full-length Caspr1, then the cell lysates were prepared and co-incubated with the beads prebound with GST-IbeA for GST pulldown assay, with GST as control. The precipitates were analyzed by western blot using His antibody (upper). Full blots are shown in Supplementary Fig. 8. The blotting membrane was stained with Ponceau S as a loading control (lower). c HBMECs were lysed and co-incubated with the beads prebound with GST-IbeA for GST pulldown assay, with GST and GST-OmpA as controls. The precipitates were analyzed with Caspr1 antibody (upper). Full blots are shown in Supplementary Fig. 8. The blotting membrane was stained with Ponceau S as a loading control (lower). d Subcellular components of HBMECs were extracted and analyzed by western blot with antibodies recognizing Caspr1, Calpain (cytosolic marker), VE-cadherin (membrane marker), and Fibrillarin (nucleus marker), respectively (upper). Full blots are shown in Supplementary Fig. 8. The blotting membrane was stained with Ponceau S as a loading control (lower). e HBMECs were fixed and immunofluorescence was performed with antibodies recognizing Caspr1 (Red) and VE-cadherin (Green). Arrows indicate the co-localization of Caspr1 with VE-cadherin. The expression of VE-cadherin in the nuclear fraction was undetectable in (d), thus we consider the fluorescence signals of VE-cadherin in the nucleus might be caused by non-specific staining. Scale, 50 μm. f The rat brain slices were prepared and stained with Caspr1 (Red) and CD31 (Green) antibodies. DAPI was used to identify nuclei (blue). Scale, 50 μm. g Ultra-thin sections were prepared from the rat brain and labeled with primary antibody recognizing Caspr1, followed by incubation with secondary antibody conjugated with 10-nm gold particles. Images were acquired using transmission electron microscope. EC: endothelial cell, BP: brain parenchyma, Lumen: vascular lumen. Arrowheads indicate labeling of Caspr1 in the luminal side of endothelial cell whereas arrows indicate intracellular labeling. Scale, 100 nm. The zoom-in windows of the positive labeling of the luminal Caspr1 were provided (right). All the images are representative of three independent experiments

