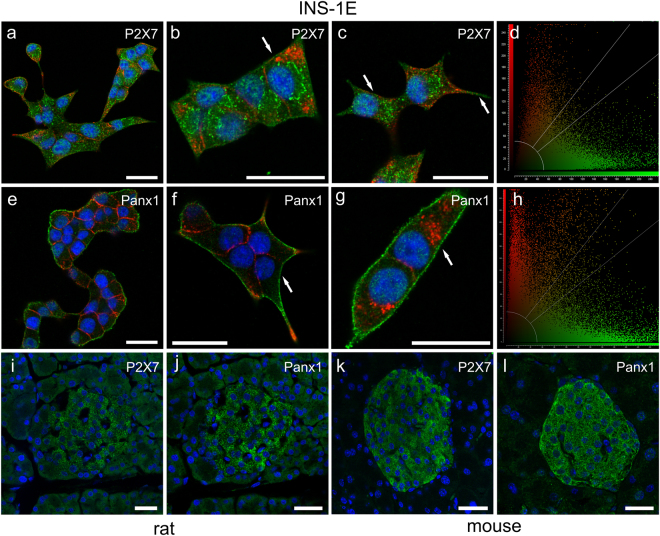
Figure 2.
Immunolocalization of P2X7R and Panx1 in INS-1E cells, rat and mouse pancreas. Overlay images of INS-1E cells stained for P2X7R (a–d) and Panx1 (e–h) (green), insulin (red) and nuclei were stained with DAPI (blue). Co-localization graphs (d,h) show co-localization of P2X7R or Panx1 and insulin in corresponding images to the left (c,g). Person’s coefficient was x and y. Arrows indicate localization of the two proteins in the plasma membrane. Rat pancreas (i,j) and mouse pancreas (k,l) was stained for P2X7R (i,k) or Panx1 (j,l) (green) as above. All bars are 25 µm. Images shown here are representative of 3–10 images per slide on 3–9 independent staining experiments.

