Figure 5.
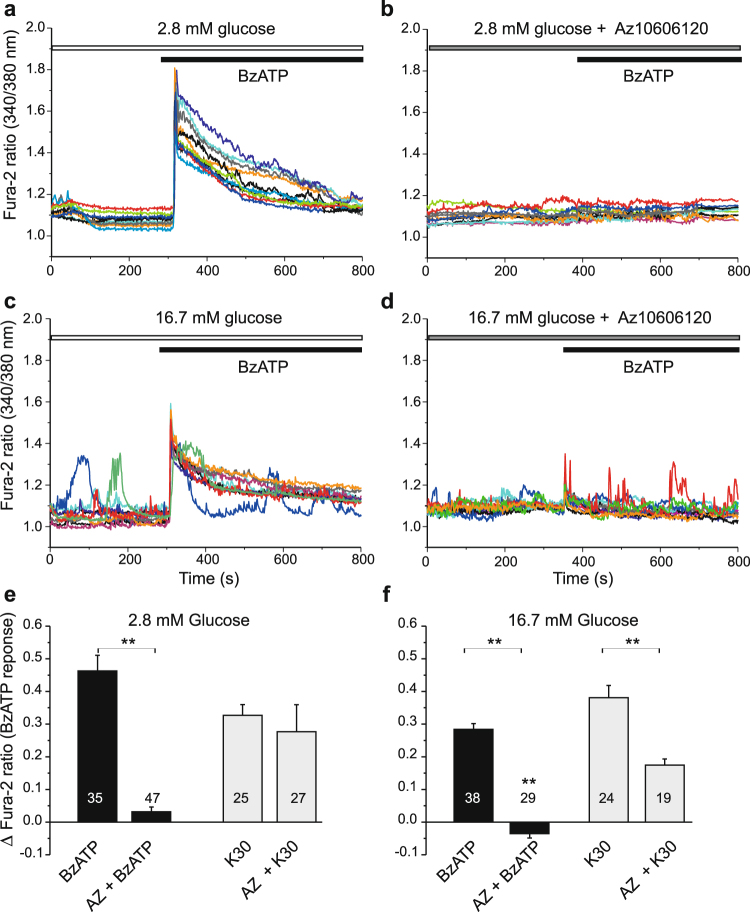
Effect of P2X7R and glucose on calcium transients. Representative recordings of intracellular Ca2+ (given as Fura-2 ratio) in INS-1E cells stimulated with BzATP (10 μM). (a) BzATP induced synchronous Ca2+ peaks in 2.8 mM glucose solutions. (b) This response was abolished by short pre-treatment with the P2X7R inhibitor (AZ10606120, 10 μM). (c) In high glucose (16.7 mM) many cells showed Ca2+ oscillations and BzATP induced synchronized Ca2+ peak. (d) Pre-treatment with AZ10606120 abolished the Ca2+ peak response. Each graph shows responses of 10 cells/experiment and each experiment was performed 3–4 times. (e,f) Bargraphs show the peak change means ± s.e.m. in fura-2 ratio in response to BzATP with/without pre-treatment with AZ10606120 (10 μM) for the two glucose concentrations indicated. The graph also shows the responses to a depolarizing K+ step (30 mM), which was carried out at the end of most experiments. Numbers indicate the number of cells analyzed in 3–4 independent experiments. Significant differences, **p < 0.01, are indicated.

