Figure 6.
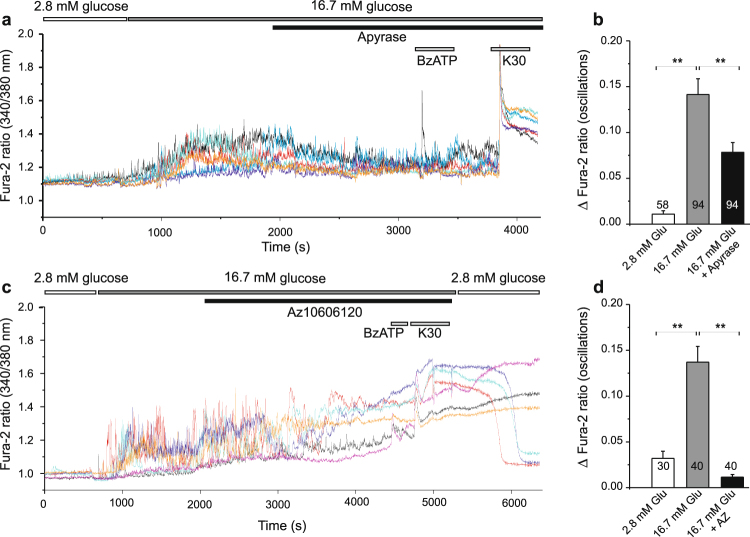
Effect of apyrase and AZ10606120 on glucose-induced calcium transients. (a) Increase in glucose (from 2.8 to 16.7 mM) induced calcium oscillations in many cells and these were reduced by introduction of apyrase (10 U/ml). BzATP (100 μM) had no, if any, effect while increase in K+ to 30 mM caused further increase in intracellular Ca2+. (c) Similar protocol as in (a) but instead of apyrase AZ10606120 (10 μM) was added to the bath. Oscillations in Ca2+ abated and Fura-2 ratio increased until medium was exchanged with fresh low glucose solution. (b, d) Bargraphs shows means ± s.e.m. of height of Ca2+ oscillations in 2.8 mM, 16.7 mM glucose with/without apyrase (b) or AZ10606120 (d). Numbers indicate the number of cells analyzed in 5 and 4 independent experiments, respectively. Significant differences, **p < 0.01, are indicated.

