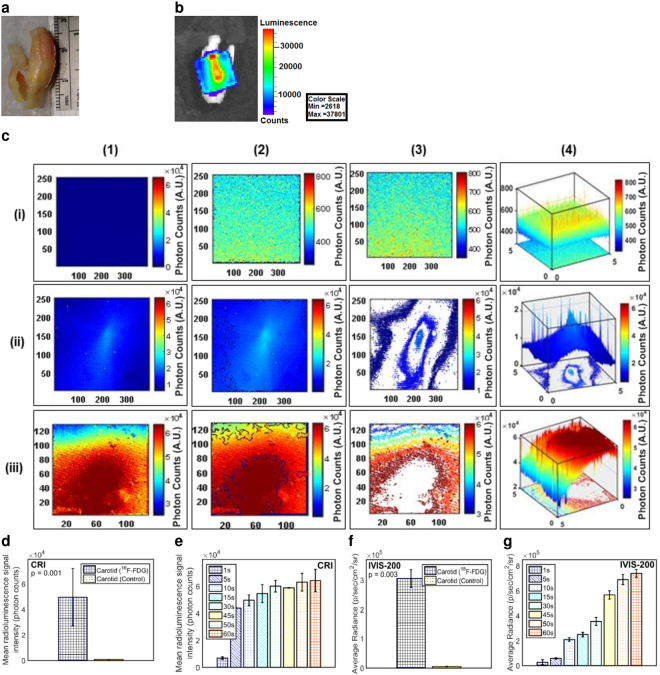
Figure 4.
Human carotid endarterectomy sample images reveal pathognomonic features of plaques (a) photograph is taken with a smart phone, (b) a confirmatory IVIS-200 image yields high radioluminescent signal at the 18F-FDG injection site during the sample is placed under a scintillating LSO crystal screen (45 second exposure time at 8 × 8 binning). The sample is rotated to highlight the location of the 18F-FDG accumulation. (c) CRI image of (i-1) control sample (pre-injection) shows no radioluminescent signal with medium 4 × 4 binning; however, (ii-1) post-injection of 50 µCi 18F-FDG shows an immediate increase of radioluminescent signal with 2 × 10⁴ photons at small 1 × 1 binning, (iii-1) 6 × 10⁴ photons at medium 4 × 4 binning. A custom written edge detection software outlines the area with this high radioluminescent signal. (i-2) No edges are detected in the control, representing the absence of 18F-FDG. (ii-2, iii-2) Post-injection image shows a distinctive edge at the deposition of 18F-FDG. A custom written software highlights the contour of the 18F-FDG signal distribution. (i-3) No contour is detected in the control sample where (ii-3, iii-3) post-injection area of the atherosclerotic plaque showed well defined contour pattern. X and Y axes in these images (i-1, ii-1, iii-1, i-2, ii-2, iii-2, i-3, ii-3, iii-3) represent the effective active imaging resolutions in pixels. 3D plot of the radioluminescent signal intensity shows (i-4) a flat distribution of signal in the control, and (ii-4, iii-4) a sharp peak of radioluminescent signal at the post-injection area. Statistically based on CRI images of (d) all human carotid endarterectomy samples show a 60-fold higher radioluminescent signal at the atherosclerotic plaque area compared to the control (45 second exposure time with binning of 4 × 4); (e) a linear relationship is identified between radioluminescent signal intensity vs. exposure time. Similarly the confirmatory IVIS-200 images (f) yield a 62-fold brighter radioluminescent signal compared to the control (45 second exposure with binning of 4 × 4); (g) a linear relationship is established between radioluminescent signal intensity vs. exposure time. All results statistically significant (P < 0.05). Figure 4 is already published in the SNMMI Annual Conference Abstract19.

