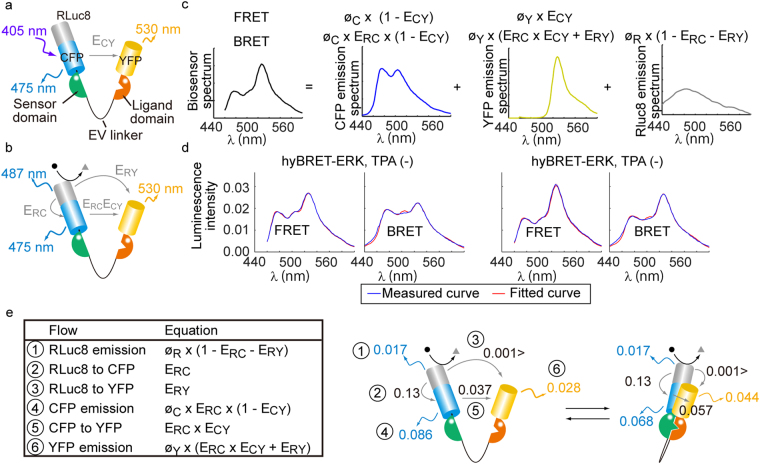
Figure 2.
Energy transfer rates in FRET and BRET modes. (a–c) Schemes of the estimation of energy transfer rates and radiative decay rates. The fluorescent (a) and bioluminescent (b) spectra of hyBRET sensors were fitted with the spectra of CFP, YFP, and RLuc8 (c) by the nlinfit function of MATLAB to estimate the parameters. (d) Overlay of the measured (blue) and fitted (red) spectra of hyBRET-ERK before and after TPA stimulation. Envelopes with light red show the 95% confidence interval in the fitted curves. The y-axis indicates the emission intensity normalized by the area of spectrum. (e) Summary of the energy flow absorbed by RLuc8. Rates of energy transfer and radiative decay are shown. ERC, ERY, and ECY are the energy transfer rates from RLuc8 to CFP, RLuc8 to YFP, and YFP to CFP, respectively. ϕC, ϕY, and ϕR are the quantum efficiencies of CFP, YFP, and RLuc8, respectively.

