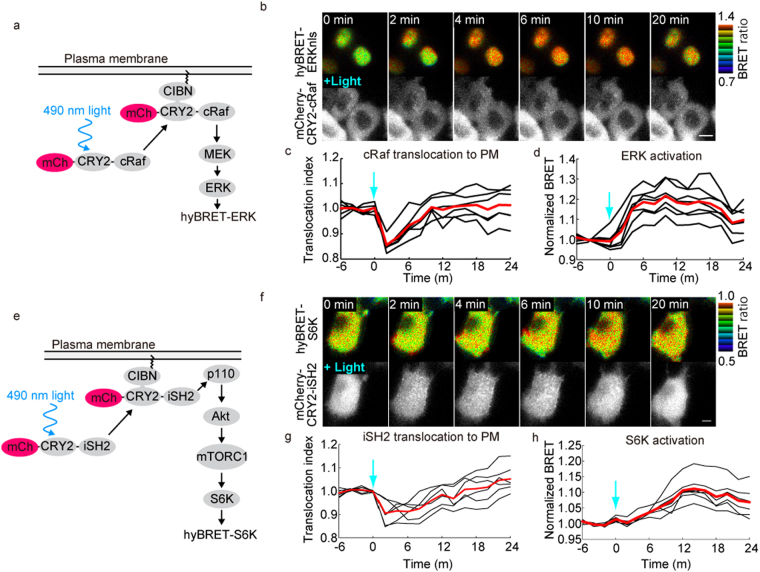
Figure 3.
Compatibility with optogenetic tools. (a,e) Scheme of light-induced activation of ERK or S6K. HeLa cells expressing hyBRET-ERKnls and mCherry-CRY2-cRaf (b–d) or hyBRET-S6K and mCherry-Cry2-iSH2 (f–h) were illuminated with 490 nm light for 100 ms. The BRET image in IMD mode and mCherry fluorescence image are shown in (b,f). (c,g) The cytoplasmic intensity of mCherry was normalized to the mean value before stimulation and used as a translocation index. (d,h) The BRET ratio normalized to the mean value before stimulation was used as normalized BRET. Averages of single cells are shown with the mean value (red). Bars, 10 μm.

