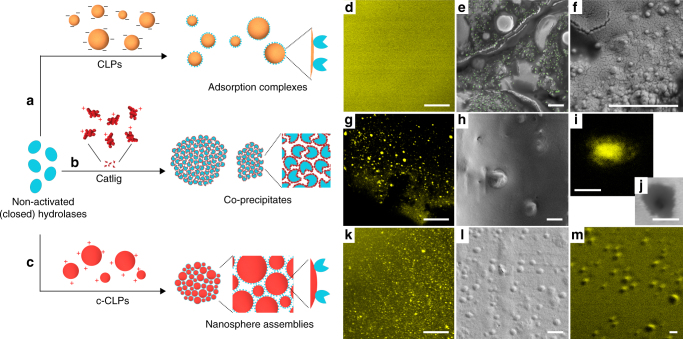
Fig. 3.
Models and microscopic images of immobilized hydrolases. a Adsorption of hydrolases on colloidal lignin particles (CLPs). b Formation of precipitates from enzymes and cationic lignin (Catlig). c Enzyme adsorption on cationic lignin nanospheres (c-CLPs), and formation of spherical clusters from enzyme-c-CLP complexes. CLSM images (d, g, i, k, m) associated with the materials in rows (a‒c) show distribution of protein on acridine orange-stained cross-sections. SEM images show distribution of CLPs (e with green coloring, f), Catlig-Lipase M precipitates (h, j), and clustered c-CLPs and Lipase M (l). Scale bars: d, g, k = 40 µm, rest = 1 µm

