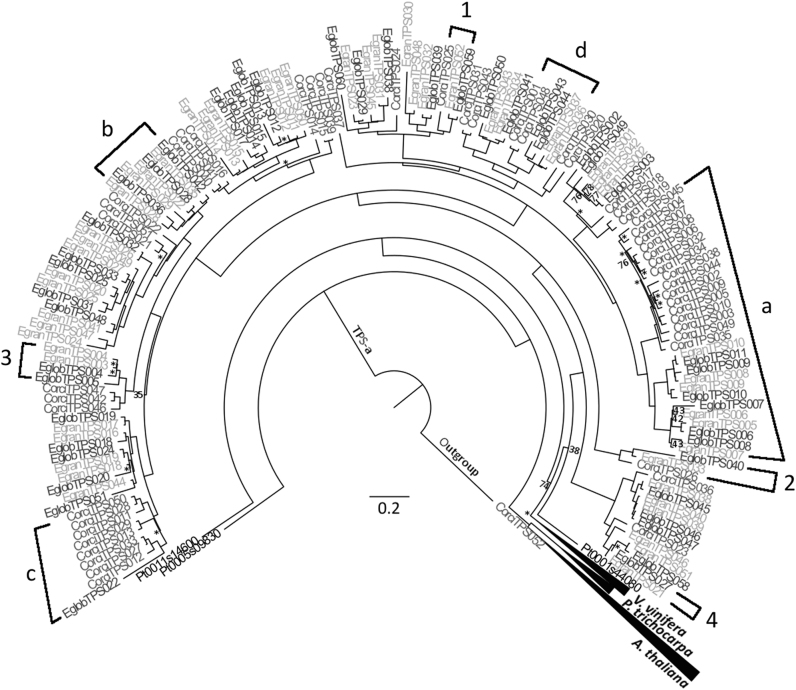
Fig. 1.
Phylogeny of the TPS-a subfamily. This tree was created through maximum likelihood analysis comparing the TPS-a subfamily from C. citriodora subsp. variegata (Corci) with those from E. grandis (Egran), E. globulus (Eglob), P. trichocarpa (Pt), V. vinifera (Vv) and A. thaliana (At). Bootstrap values supported by <80% are noted by number, while those with bootstrap values between 80 and 94% are indicated by the symbol *. All others have values >95%. Scale represents amino acid substitutions per site. A TPS-b gene from C. citriodora subsp. variegata was used as the outgroup. a–d refers to results discussed further in the text. Examples of orthologous pairings are given by numbers 1 & 2. 3 is not considered an orthologous pairing as EglobTPS004 shares its most recent ancestral gene with two genes from E. grandis rather than one. 4 is not considered an orthologous pairing as EglobTPS027 and EgranTPS021 do not share the same most recent ancestral gene. a shows an example of a clade that is expanded in CCV relative to the other eucalypts. b gives an example of genes in orthologous pairings, with the exception of EgranTPS029, which does not pair to a single gene from another species. c shows an example of a non-orthologous pairing, as EglobTPS022 is closely related to several genes from CCV rather than a specific one. d shows a clade structure possibly resulting from concerted evolution

