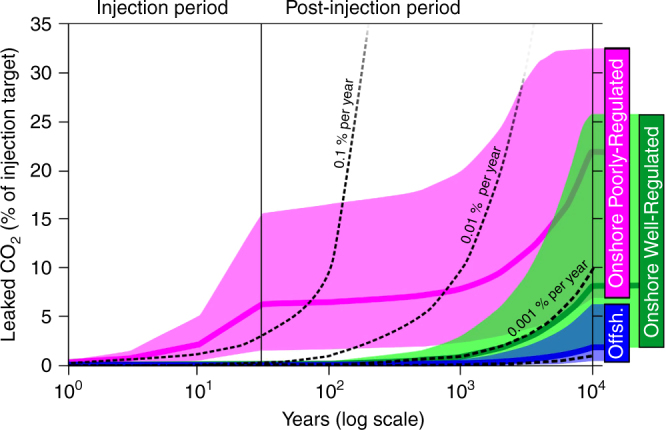
Fig. 4.

Monte Carlo runs of the three scenarios. The graphs show cumulative leakage of CO2 as a percentage of the total injected. Each scenario shows the P50 output as a blue, green, or magenta line, with shading above showing the P05 limit, and below for the P95 limit, defining occurrence envelopes for the three scenarios. These are calculated on 12 Gt CO2 injected between 2020–2050, with subsequent storage and leakage over 10,000 years. Black dotted lines show comparisons based on time averaged yearly constant leak rates for 0.1, 0.01, 0.001 and 0.0001% per year (the latter represented by the unlabelled dotted line at the base of the diagram). Offshore Well-Regulated storage (blue) is found to be the most reliable Scenario. Onshore Well-Regulated storage (green) exhibits higher leakage due to a higher density of abandoned wells acting as potential leakage pathways. Poorly-Regulated Onshore storage (magenta) exhibits the highest leakage rates in the short term due to the prevalence of unidentified abandoned wells that are unplugged or degraded
