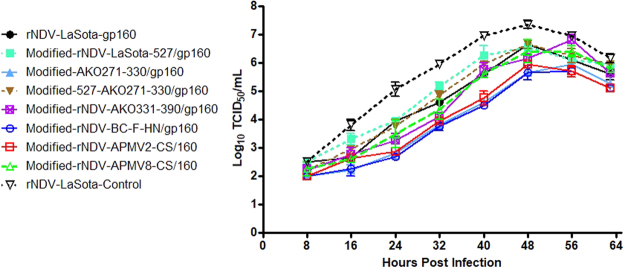
Figure 5.
In Vitro growth kinetics of rLaSota and modified rNDV vectors expressing SIV gp160 in DF-1 cells. DF-1 Cells were infected with their respective viruses at 0.001 MOI, in the presence of 10% fresh chicken egg allantoic fluid and 2% FBS. Cell culture supernatant samples were harvested every 8 h intervals until 64 h post infection and titrated by TCID50 assay in DF-1 cells. The graph shows the geometric mean ± standard error of the mean (SEM) of TCID50 values.

