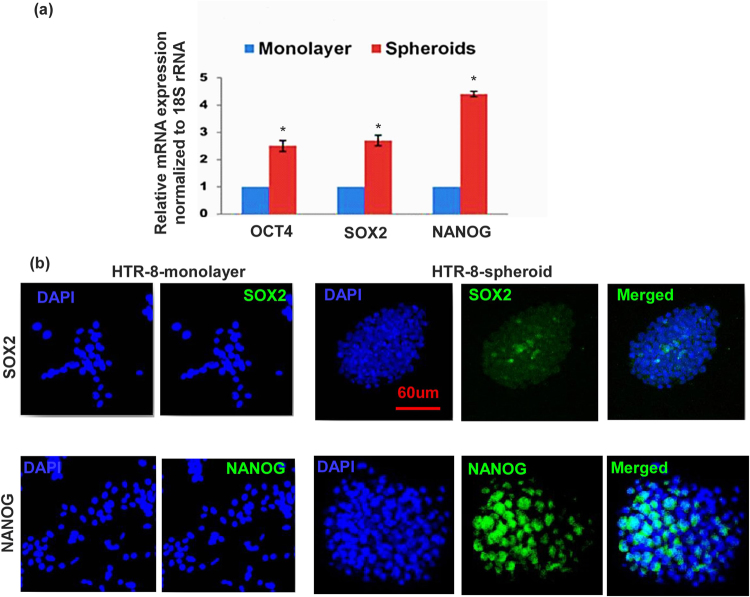
Figure 2.
HTR cells grown as spheroids reveal marked increase in ES markers compared to monolayers. (a) Shows mRNA expression of ES markers OCT4 (Ct = 23.1), SOX2 (Ct = 22.1), NANOG (Ct = 25.2),) in HTR cells grown as spheroids as compared to monolayers on plastic surface (n = 5, *indicates p < 0.05). (b) Shows immunostaining for SOX2 and NANOG under the same conditions. Representative images are selected from 5 different experiments.

