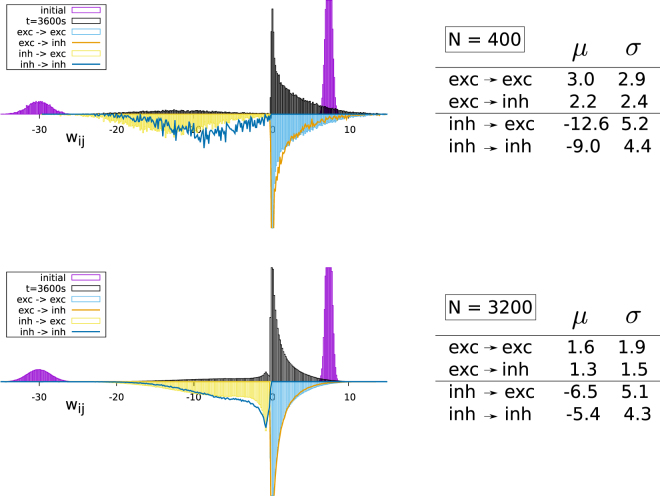
Figure 5.
Top: The distribution of the synaptic weights wij for N = 400 site networks with a link probability of p = 0.2 and 80% excitatory and 20% inhibitory neurons. Bottom: The same for N = 3200 neurons. Shown are in the right panels the histograms of the initial distribution (violet, top part truncated) and the distribution as obtained after a mathematical simulation time of 3600 seconds. Black: the overall distribution of synaptic weights and (reflected with regard to the x-axis) the individually normalized partial distributions (excitatory/inhibitory) → (excitatory/inhibitory) neurons. The respective means μ and standard deviations σ of the partial distributions are given in the panels on the right.

