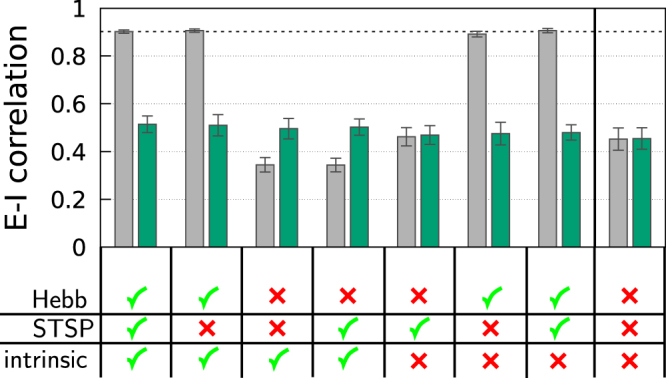
Figure 7.

The E-I cross-correlation between excitatory and inhibitory inputs for a 50/50 system with N = 400 neurons. Shown is |ρ±| = −ρ±, as defined in (10), which was measured either after 1 hour (gray bars), or right at the start (green bars). For the time average a period of 10 sec has been used in both cases. The error bars have been evaluated with respect to 100 initial weight configurations drawn each time from Gaussians with means 7.5 (−15.0) and standard deviations 0.375 (1.5) for excitatory and inhibitory synapses, respectively. The initial synaptic weight configuration is therefore not balanced (as for Fig. 6). Shown are the results for distinct scenarios with Hebbian plasticity (Hebb), short-term synaptic plasticity (STSP) and intrinsic plasticity (intrinsic) being either turned on (green checkmark) or off (red cross).
