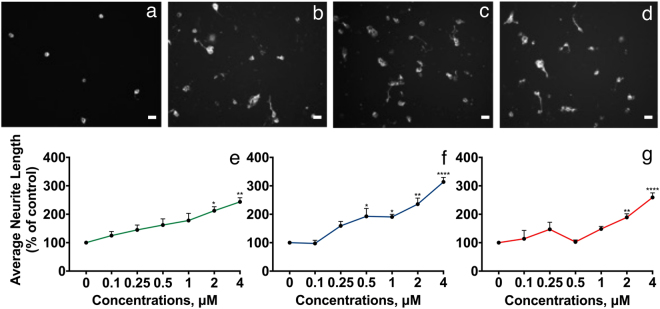
Figure 4.
NCAM2 FnIII1, FnIII2 and FnIII1-2 domains induce neurite outgrowth. CGNs were grown for 24 h on a coat of different concentrations of recombinant NCAM2FnIII-domains. The neurons were immunostained and neurite lengths were estimated by a stereological approach from the recorded micrographs. Top panel: Representative micrographs showing CGNs grown on 0 μM protein (control, a), and 4 μM NCAM2 FnIII1 (b), FnIII2 (c), and FnIII1-2 (d), respectively. (e–g) Concentration-response curves for normalized average neurite length vs. concentration of NCAM2 FnIII1 (e), NCAM2 FnIII2 (f), and NCAM2 FnIII1-2 (g), respectively. Before cells were plated the wells were coated with 7 concentrations of the respective NCAM2 FnIII domains (0, 0.3125, 0.625, 1.25, 2.5, 5.0, 10.0 µg/cm2). Data have been normalized to the negative control (0 μM protein) and are shown as mean and SEM (n = 3–4). The individual concentration-response data were analyzed separately by one-way ANOVA for repeated measures followed by Tukey’s multiple comparison test. All 3 proteins significantly induced neurite outgrowth. NCAM2 FnIII1: F (6, 21) = 3.472, p < 0.0153. NCAM2 FnIII2: F (6, 12) = 18.72, p < 0.0001. NCAM2 FnIII1-2: F (6, 12) = 13.94, p < 0.0001. *,** and ***p < 0.05, 0.01, and 0.001, respectively, when compared to the negative control. Scale bars = 10 µM. The total average neurite length per cell for domains can be found in Supplementary Table S2.

