Fig. 2.
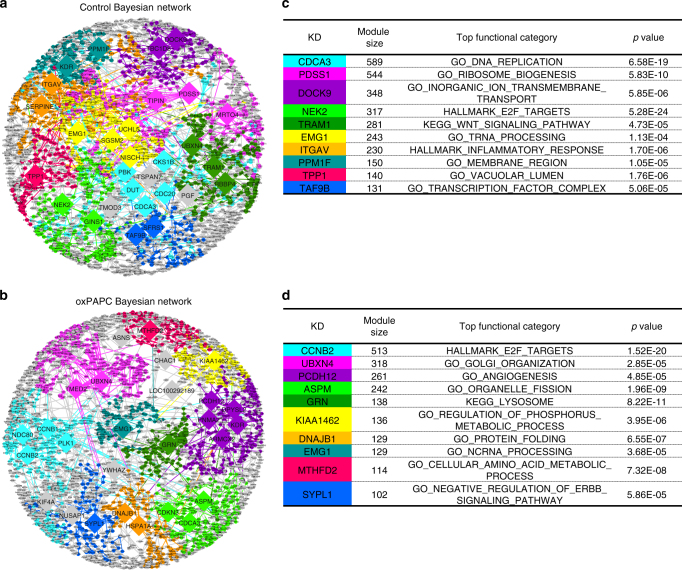
Bayesian networks of HAEC reveal novel key drivers in response to oxidized phospholipids. a, b Network view of HAEC Bayesian network of control state (a) and oxPAPC-treated state (b). Key drivers with more than 100 downstream nodes are indicated and ten top-ranked subnetworks according to strength of enrichment and subnetwork size are colored. Edges are colored according to source node. c, d List of ten subnetworks colored within control (c) and oxPAPC (d) Bayesian network with most top key driver, number of nodes, most significant overrepresented functional category and p value are listed

