Fig. 5.
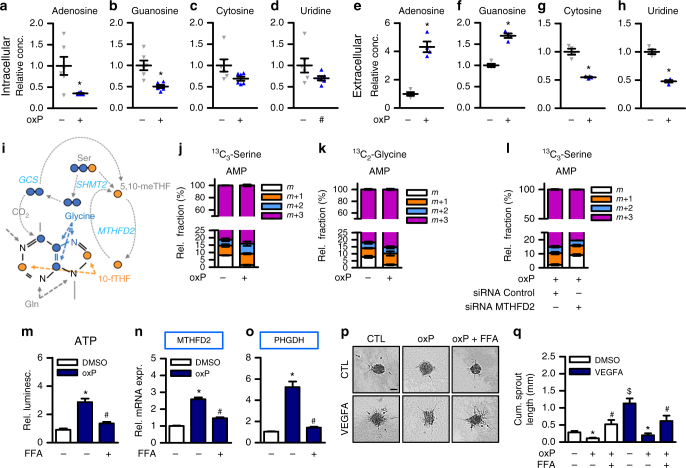
OxPAPC elicits ATP release and inhibition of ATP release prevents induction of MTHFD2. a−d Nucleoside measurement in HAEC exposed to medium (1% FCS) with (oxP) or without (Ct) oxPAPC for 24 h. Cell lysates were measured by mass spectrometry (n = 6). (*p ≤ 0.05 Student’s t test). e−h Nucleoside measurement in supernatants of HAEC exposed to medium (1% FCS) with or without oxPAPC for 24 h. Supernatants were measured by mass spectrometry (n = 4) (*p ≤ 0.05 Student’s t-test) i Scheme of flow of serine- and glycine-derived carbons which can be incorporated into the purine backbone. j, k HAEC were treated with 13C3-serine (j) or 13C2-glycine (k) and oxPAPC or control for 24 h and supernatants were measured by mass spectrometry (n = 3). Relative fractions of extracellular AMP containing no (m), one (m + 1), two (m + 2) or three (m + 3) heavy carbons are shown. l 24 h flux analysis with 13C3-serine labeling in HAEC with or without siRNA mediated knockdown of MTHFD2 (n = 3). m ATP measurement of supernatants of HAEC exposed to medium (1% FCS) with or without oxPAPC and flufenamic acid (FFA, 50 µM) for 8 h. ATP was measured by luminescence and normalized to intracellular RNA concentration (n = 7). n, o qRT-PCR detection of MTHFD2 and PHGDH in HAEC exposed to medium (1% FCS) with or without oxPAPC and flufenamic acid (FFA, 50 µM) for 24 h (n = 5). p, q Spheroid outgrowth assay (p) and quantification (q) of the cumulative sprout length of HUVEC treated with combinations of oxPAPC, flufenamic acid (FFA, 50 µM) and VEGF-A165 (10 ng ml−1) as indicated (n = 6). Scale bar: 50 µM. Data are represented as mean ± SEM, *p ≤ 0.05 (oxP vs Ct), #p ≤ 0.05 (inhibitor present vs absent), $p ≤ 0.05 (VEGFA vs Ct), (ANOVA with Bonferroni post-hoc test if not otherwise indicated)

