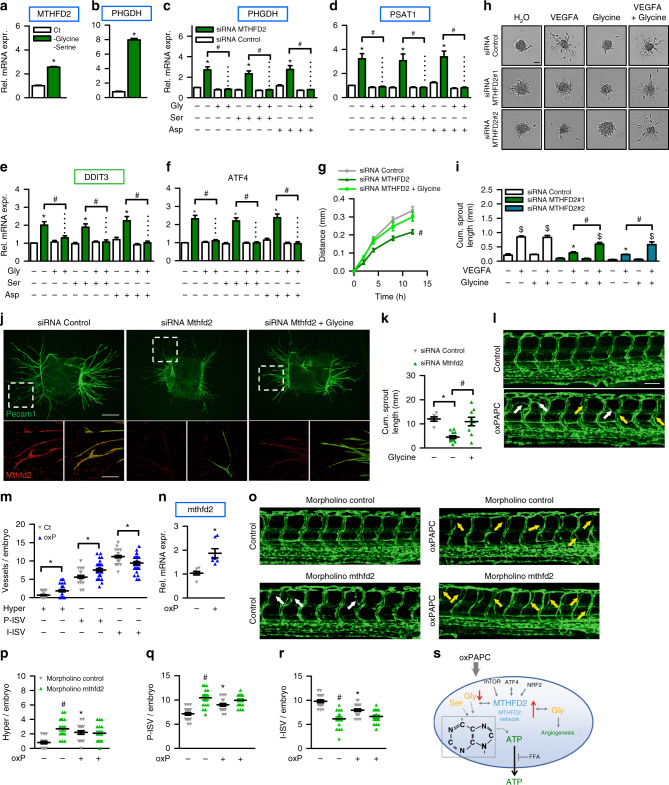
Fig. 6.
MTHFD2-dependent glycine is crucial for angiogenesis. a, b qRT-PCR detection of MTHFD2 and PHGDH in HAEC treated with (Ct) or without serine (300 µM) and glycine (30 µM) for 16 h (n = 4). (*p ≤ 0.05 Student’s t test) c−f HUVEC treated with the indicated siRNAs were supplemented with or without glycine, serine or asparagine (500 µM) for 16 h (n = 8). DDIT3 DNA damage inducible transcript 3 (also known as CHOP). g Scratch wound migration assay of HUVEC treated with the indicated siRNAs and supplemented with or without glycine (500 µM). Migration distance after application of scratch is depicted (n = 5). (ANOVA with repeated measures) h, i Spheroid outgrowth assay (h) and quantification of the cumulative sprout length (i) of HUVEC treated with or without the siRNAs indicated and VEGF-A165 (10 ng ml−1) or glycine (500 µM) (n = 6). Scale bar: 50 µM. j, k Immunofluorescence (j) and quantification of cumulative sprout length (k) of aortic ring outgrowth in organ culture treated with the indicated siRNAs and glycine (500 µM) (n = 6–12). Pecam1 was used as a marker for endothelial cells. Scale bars: 500 µM (overall image), 100 µM (zoom) l, m Confocal microscopic image (l) of zebrafish vasculature of tg(fli1:EGFP) embryos at 72 h post-fertilization (hpf) injected without or with 1 µg µl−1 oxPAPC into yolk at 0.5 hpf. White arrows indicate hyperbranches and yellow arrows indicate partial normal intersegmental vessels. Quantitative morphological analysis (m) in control (n = 30) and oxPAPC (n = 31) group shows hyperbranches (Hyper), partial normal (P-ISV) and intact (I-ISV) intersegmental vessels per embryo. The experiment was performed two times. Scale bar: 100 µM. n qRT-PCR of zebrafish embryos in m normalized to elongation factor 1-alpha (elfa) (4–5 embryos pooled per sample) (n = 7). o–r Confocal microscopic image (o) and quantification (p−r) of tg(fli1:EGFP) embryos at 72 hpf injected with control (n = 20) or mthfd2 morpholino (n = 20) at 0.5 hpf with (n = 19) and without 1 µg µl−1 oxPAPC (n = 20). Data are represented as mean ± SEM; c−i *p ≤ 0.05 (MTHFD2 vs Control siRNA), #p ≤ 0.05 (with vs without amino acid), $p ≤ 0.05 (VEGFA vs Ct) (ANOVA with Bonferroni post-hoc test); m−r *p ≤ 0.05 (oxP vs Ct), #p ≤ 0.05 (mthfd2 vs control morpholino) (ANOVA with Newman−Keuls post-hoc test). s Proposed model of findings

