Figure 1.
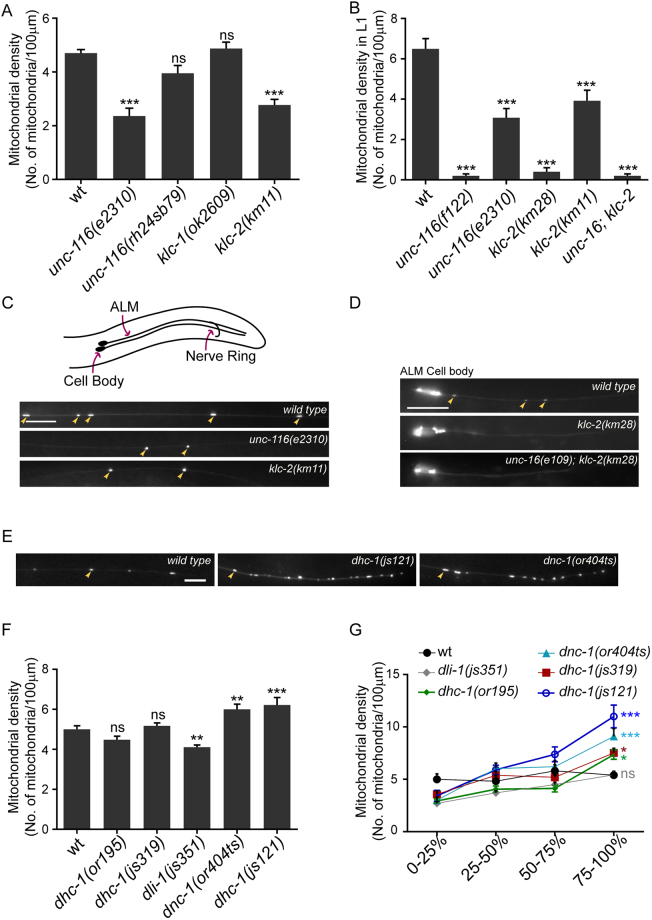
Kinesin-1 and Dynein regulate mitochondrial density in the anterior touch receptor neuronal process. (A) Mitochondrial densities in one day adult ALM (anterior lateral mechanosensory) TRNs (touch receptor neurons) of wild type (jsIs609) and Kinesin-1 motor subunit hypomorphic mutants. n = 16–20 worms. All comparisons made to wild type. (B) Average mitochondrial densities in ALM TRN processes of just hatched L1 animals of the following genotypes: Kinesin-1 subunit null alleles (f122, km28), Kinesin-1 subunit hypomorphic alleles (e2310, km11) and a double mutant unc-16(e109); klc-2(km28). n = 16–20 worms. All comparisons made to wild type. (C) Representative images of mitochondria in the ALM TRN processes of wild type (jsIs609), unc-116(e2310) and klc-2(km11) one day adults. Orientation of the anterior TRNs (here only ALM) and schematic representation of the worm is shown above fluorescent images. Scale bar = 10 μm. (D) Representative images of the ALM TRN processes of wild type (jsIs609), klc-2(km28) and unc-16(e109); klc-2(km28) L1 animals. Scale bar = 10 μm. (E) Representative images of the distal ALM TRN processes in wild type (jsIs609), dhc-1(js121) and dnc-1(or404ts) (grown at 22 °C). Scale bar = 10 μm (F) Average mitochondrial densities in the ALM TRN processes of Dynein-Dynactin complex mutants. n = 10–20 worms. All comparisons made to wild type (G) Mitochondrial density across different segments along the ALM TRN processes in wild type, Dynein mutants and Dynactin mutants. n = 10–16 worms. All comparisons made to wild type. Colours correspond to respective genotypes. Some mitochondria marked with yellow arrows in (C,D) and E. Data represented as Mean ± SEM. Statistical tests used for A,B and F: One-way ANOVA, for G: Two-way ANOVA. All tests use Bonferroni multiple comparisons correction, ns: not significant, p value * < 0.05, ** < 0.01, *** < 0.001.

