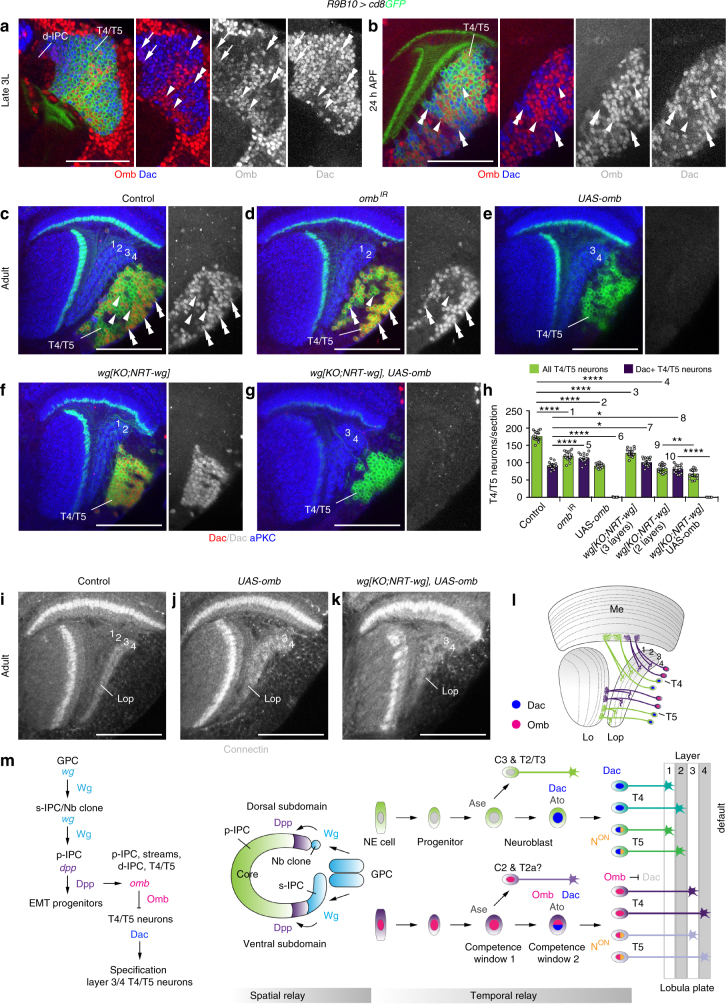
Fig. 8.
Omb converts layer 1/2 into layer 3/4 T4/T5 neurons by Dac downregulation. a, b In the 3rd instar larvae (a), Omb (red) and Dac (blue) were initially co-expressed (arrows) in new-born R9B10-Gal4 UAS-cd8GFP (green) labeled T4/T5 neurons close to the d-IPC. In some more mature T4/T5 neurons, that were positive for Omb, Dac expression was low (arrowheads), while in others, Dac expression was high (double arrowheads) and Omb expression was absent. At 24 h after puparium formation (APF) (b), Dac (double arrowheads) and Omb (arrowheads) show mutually exclusive expression. c–g In controls (c), Dac (red, double arrowheads) was expressed in approximately 50% of T4/T5 neurons. Arrowheads indicate Dac-negative R9B10-Gal4 UAS-cd8GFP (green) labeled T4/T5 neurons. Dac was maintained in almost all T4/T5 neurons following omb knockdown (d), and downregulated following omb overexpression (e). Dac was expressed in all T4/T5 neurons in wg{KO;NRT-wg} flies with two lobula plate layers (f). Ectopic Omb was sufficient to downregulate Dac in these flies (g). h Quantification of all and Dac-positive T4/T5 neuron numbers following omb manipulations. The scatter plot with bars shows data points and means with ±95% confidence interval error bars (n = 15 corresponding to three serial optical sections, 6-μm apart, from five samples per genotype). Unpaired, two-tailed Student’s t-test not assuming equal variance: P = 5.57 × 10⁻¹², P = 6.19 × 10⁻¹⁵, P = 1.26 × 10⁻¹⁰, P = 1.98 × 10⁻¹⁷, P = 3.60 × 10⁻⁵, P = 4.79 × 10⁻¹⁵, P = 0.020, P = 0.017, P = 0.0015, P = 2.42 × 10⁻¹³. *P < 0.05; **P < 0.01; **** P < 0.0001. i–k Unlike in controls (i), R9B10-Gal4-mediated ectopic UAS-omb expression in T4/T5 neurons of wild type (j) or wg{KO;NRT-wg} (k) flies resulted in ectopic Connectin expression in the lobula plate (Lop). l Schematic illustrating Dac and Omb expression in adults. m Working model for spatial and temporal relay mechanisms regulating the formation and specification of layer-specific T4/T5 neurons. For genotypes and sample numbers, see Supplementary Table 1. Scale bars, 50 μm

