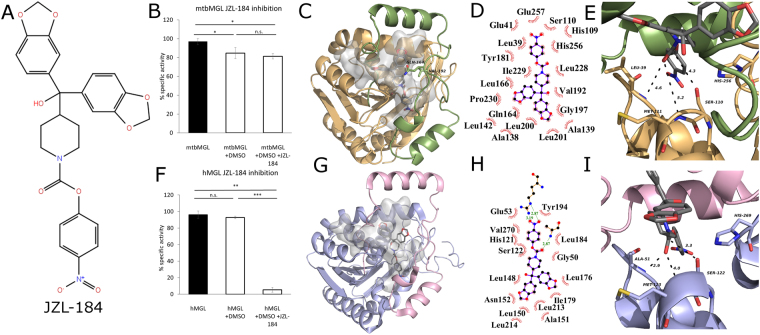
Figure 4.
(A) Structure formula of JZL-184 as it was used for docking studies. The model was built using the 2D sketcher in Meastro (Maestro, Schrödinger, LLC, New York, NY, 2017). (B) Inhibition assays for mtbMGL and JZL-184 in DMSO and DMSO as control using 1-rac-oleoyl glycerol as substrate. (C) Cartoon representation of mtbMGL structure with JZL-184 docked. The gray blob shows the cavity inside the protein and the gray sticks the docked JZL-184. The cap is shown in green with Gln164 and Val192 restricting the cavity as sticks, core in wheat. (D) Ligplot+48 graph of JZL-184 docked to mtbMGL. The hydrophobic interactions are shown as brown circle sections. (E) Close up view on the active site serine and the oxyanion hole forming residues in the JZL-184 mtbMGL structure. JZL-184 is shown as gray sticks. (F) Inhibition assay for hMGL using JZL-184 as inhibitor and DMSO as control. (G) hMGL structure (PDB ID 3HJU, chain A) with JZL-184 docked. The cap is shown in pink and the core in light blue. The gray blob depicts the cavity inside the protein and the gray sticks the docked JZL-184. (H) Ligplot+48 graph of JZL-184 docked to hMGl (PDB ID 3HJU, chain A). (I) Close up view on the catalytic triad and the residues forming the oxyanion hole in the JZL-184 docked hMGL structure (PDB ID 3HJU, chain A) JZL-184 is shown as gray sticks.

