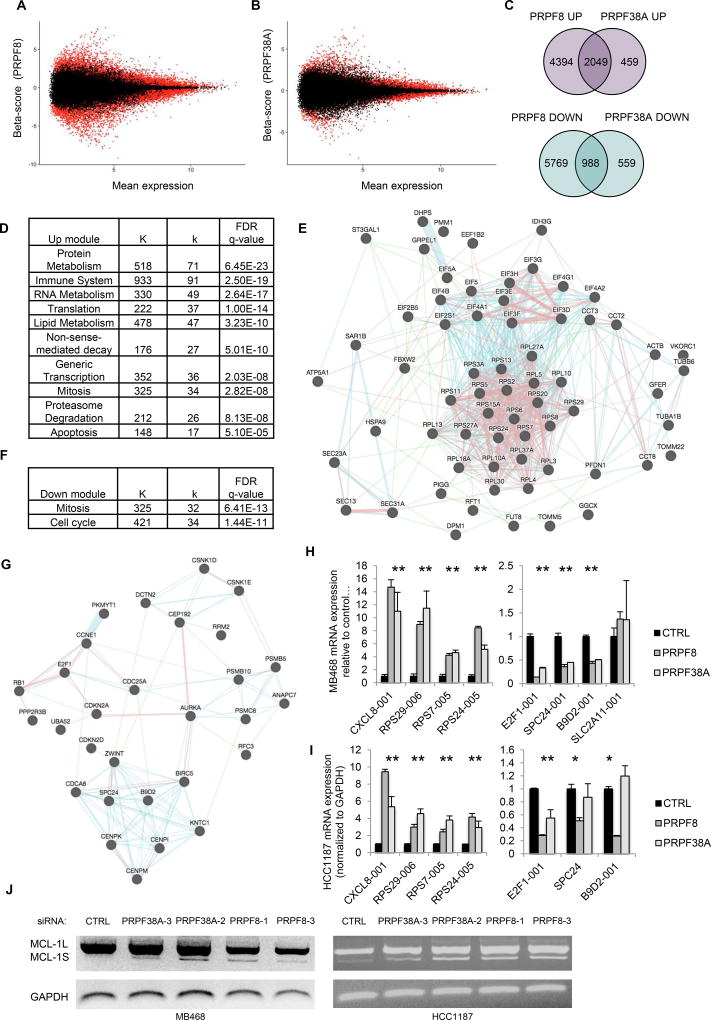
Figure 4. PRPF8 or PRPF38A knockdown regulate splice variants of genes implicated in protein metabolism, mitosis, proteasome function and apoptosis.
(A–B) Bland-Altman (MA) plots of transcript-level mean expression by RNA-seq in viable MB468 cells 48 hr after transfection with PRPF8 (A) or PRPF38A (B) siRNAs, relative to nontargeting siRNA. B score is the beta coefficient from the Sleuth analysis. Red indicates q <0.05.
(C) Venn diagrams showing the number of shared up-regulated (top) or down-regulated (bottom) transcripts in MB468 cells transfected with PRPF8 or PRPF38A siRNAs relative to nontargeting siRNA.
(D) Significantly over-represented Reactome modules (q<0.01) among up-regulated transcripts in PRPF8-KD and PRPF38A-KD cells. Full list in Table S8. K indicates the total number of genes in each module; k indicates the number of up-regulated transcripts assigned to each module.
(E) Functional interaction map of protein metabolism proteins corresponding to transcripts upregulated in viable PRPF8-KD and PRPF38A-KD. Map generation and interaction key as in Fig. 1D.
(F) Significantly over-represented Reactome modules (q<0.01) among down-regulated transcripts in MB468 cells knocked down for PRPF38A, as in (D). Full list in Table S9.
(G) Functional interaction map of mitosis proteins (based on MSigDB) corresponding to transcripts down-regulated in viable PRPF8-KD and PRPF38A-KD cells as in (E).
(H,I) Levels of the indicated transcripts in MB468 (H) or HCC1187 (I) 48 hr after transfection with siRNAs against PRPF8 or PRPF38A relative to non-targeting siRNA, as determined by qRT-PCR using isoform-specific primers. Data represent the mean ± S.D. of at least 2 independent experiments (*, p <0.05; t-test relative to control).
(J) RT-PCR analysis of MCL1 splicing using primers that distinguish between different MCL1 isoforms in MB468 and HCC1187 cells 48 hr after transfection with indicated siRNAs. Top and bottom bands correspond to MCL1-001 and MCL1-002 transcripts, respectively.

