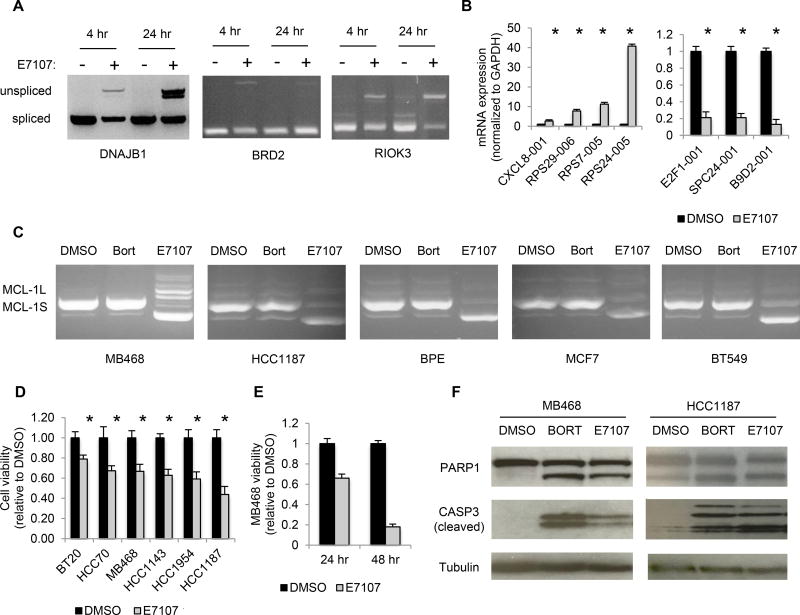
Figure 5. The splicing modulator drug E7107 causes intron retention, affects PRPF8- and PRPF38A-sensitive splice variants and promotes apoptosis in basal-A cell lines in vitro.
(A) RT-PCR using intron-spanning primers for the indicated genes of total RNA from MB468 cells treated with 100 nM E7107 (+) or DMSO (−) for the indicated time.
(B) Transcript mRNA levels, determined by qRT-PCR of the indicated genes using isoformspecific primers, in MB468 cells treated with 100 nM E7107 or DMSO for 24 hr. Data represent the mean ± S.D. of at least 3 independent experiments (*, p <0.05; t-test relative to control).
(C) RT-PCR analysis of MCL1 splicing as in (Fig. 4J) in the indicated cell lines treated with E7107, bortezomib (Bort; used as control) or DMSO for 24 hr.
(D–E) Viability of indicated cell lines after treatment with E7107 or DMSO after 24 hr (D) or after culture for an additional 24 hr in drug-free medium (E), relative to DMSO-treated cells. Data represent the mean ± S.D. of at least 3 independent experiments (*, p <0.05; t-test relative to control).
(F) Immunoblot probed for the indicated proteins of lysates of MB468 and HCC1187 cells treated with 100 nM E7107, 12.5 nM Bortezomib (Bort) or DMSO for 24 hr.

