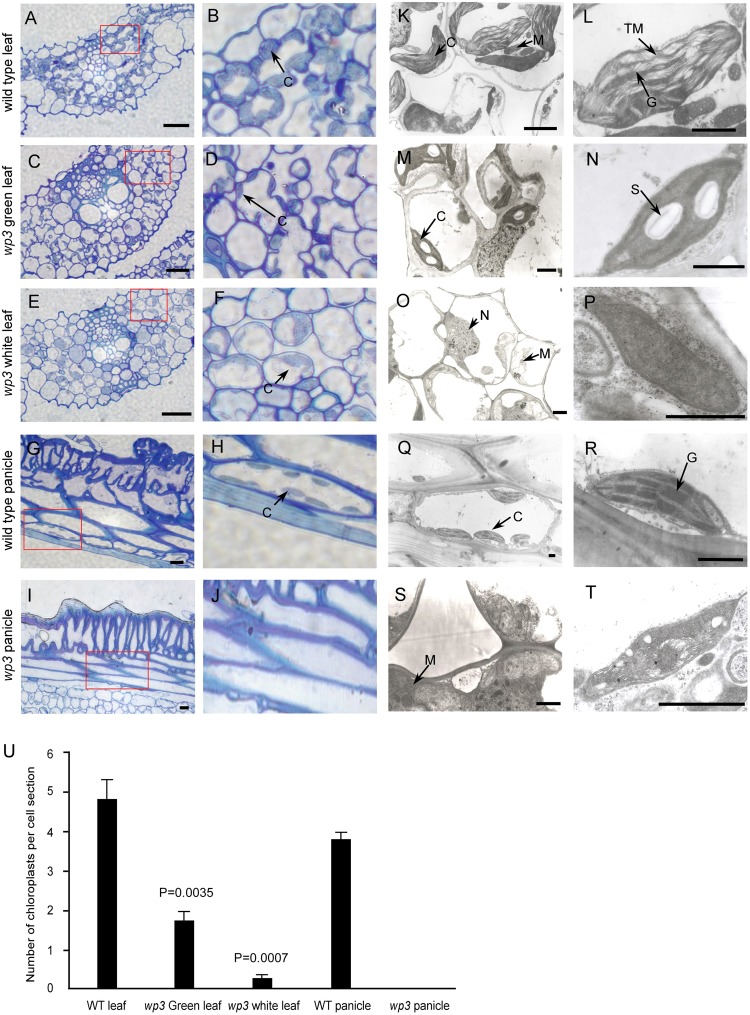
FIGURE 2.
Chloroplast developmental defects in wp3 mutant. (A–J) Histological images of cells from wild type and wp3 mutant. (A–F) Showed the chloroplast in leaf cell; (G–J) showed the chloroplast in panicle cell. (B,D,F,H,J) Showed the enlarged images in red frames in (A,C,E,G,I), respectively. C, chloroplast. Scale bars = 30 μm. (K–T) TEM images of chloroplast in wild type and wp3 mutant. (K–P) Showed the chloroplast in leaf cell; (Q–T) showed the chloroplast in panicle cell. (L,N,P,R,T) Showed the single chloroplast. C, chloroplast; G, grana; M, mitochondria; N, nucleus; S, starch granule; TM, thylakoid membranes. Scale bars = 1 μm. (U) Quantification of chloroplast numbers in wild type and wp3 mutant. The data from three biological replicates are shown as mean ± SD.

