FIGURE 7.

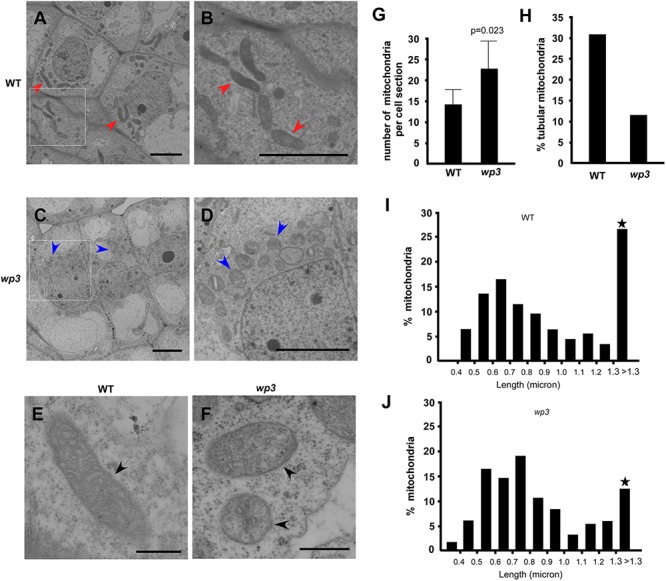
Mitochondria maturation is blocked/delayed in wp3 mutant. (A–F) TEM images of mitochondria within wild-type (A,B,E) and wp3 ovary cells (C,D,F). (B,D) Showed the enlarged images within frames of (A,C). (E,F) Showed single mitochondria in wild type plant and wp3 mutant, respectively. Arrows with red color in (A,B) indicated the elongated tubular mitochondria in wild-type cells; blue arrows in (C,D) indicated the round mitochondria in mutant cells; black arrows in (E,F) indicated the single mitochondria. (G,H) Quantification analysis of mitochondria numbers (G) and shapes (H) in wild type and wp3 mutant. (I,J) Quantification of mitochondrial with various long axes in wild-type plant and wp3 mutant cells. Stars indicated that the greatest difference was detected between wild type plant and wp3 mutant.
