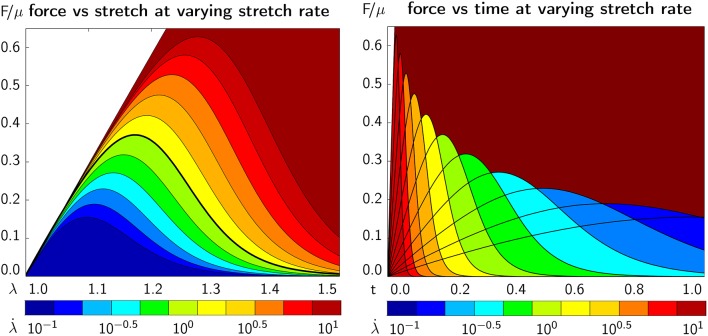
Figure 10.
Continuum axonal damage. Axonal force vs. axonal stretch (Left) and time (Right) at varying stretch rates and constant bond strength. The dark red area marks the elastic, undamaged regime. The graphs demonstrate an emergent feature of our transient crosslink model: For increasing stretch rates, the peak axonal force increases (Left) but is reached earlier in time (Right).

