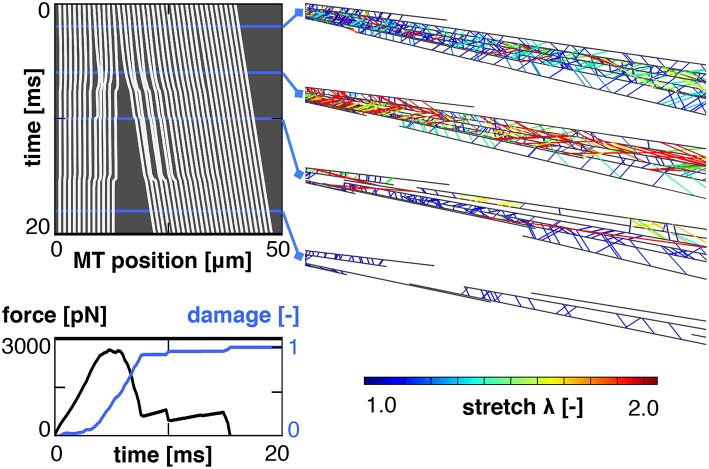
Figure 5.
Characteristic output of a single simulation. The kymograph, (Top left), tracks the position of all microtubules throughout the simulation. It reveals a complete separation between the proximal and distal ends of the axon. This separation manifests itself in a loss of the required external force and an increase in axonal damage (Bottom left). Four snapshots of the axon show the crosslinks color coded by crosslink stretch (Right). These snapshots show an initial increase in crosslink stretch, followed by a decrease after the proximal and distal sets of microtubule bundles have separated.

