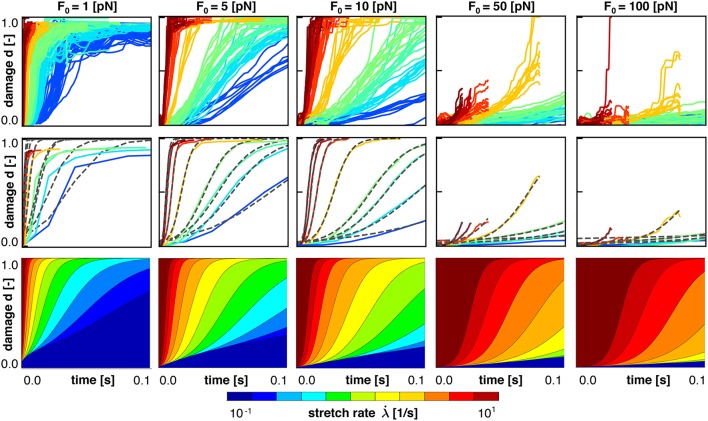
Figure 7.
Axonal damage vs. time color coded by the stretch rate for five bond strengths. Discrete axonal damage simulations with n = 10 simulations for each stretch rate (Top); homogenization using the average response for each stretch rate to identify the parameters for S-shaped curve of the homogenized damage model (Middle); and continuum axonal damage simulation (Bottom). The graphs represent the same data as in Figure 6, and demonstrate an important feature of the Bell model: at higher stretch rates, axonal damage occurs at higher axonal stretch, but earlier in time.

