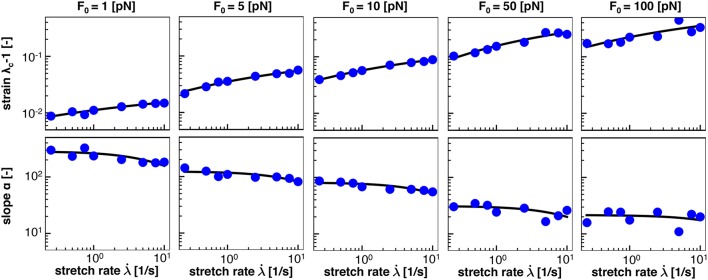
Figure 8.
Homogenization of half damage stretch λ50 and damage slope α from average response of n = 10 discrete axonal damage simulations for as function of the stretch rate, , for five bond strengths, F0. Blue dots represents λ50 and α values from the average damage vs. stretch relations in Figure 6; solid black lines represent homogenization using Equations (19) and (20) for five bond strengths, F0.

