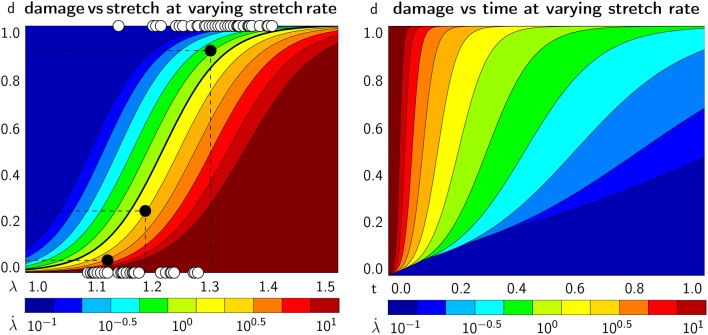
Figure 9.
Continuum axonal damage. Axonal damage vs. axonal stretch (Left) and time (Right) at varying stretch rates and constant bond strength. White circles represent experimentally characterized damaged, d = 1, and undamaged, d = 0, nervous tissue samples at different strain levels (Bain and Meaney, 2000). Black circles define the conservative damage threshold at 14% strain, the liberal damage threshold at 34% strain, and the optimal damage threshold at 21% strain (Bain and Meaney, 2000). The graphs demonstrate an emergent feature of our transient crosslink model: For increasing stretch rates, damage develops at a larger stretch (Left) but earlier in time (Right).

