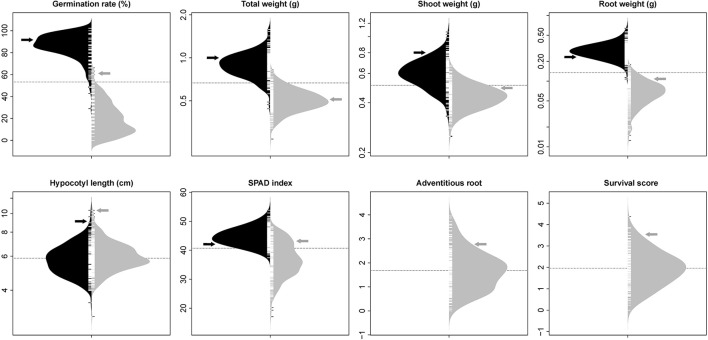
Figure 1.
Bean plots represent the distribution of traits in non-flooded (black) and flooded (gray) conditions. The units of y-axis for each trait was mentioned after the name of the trait on the top of each graph. The arrows indicate the values of tolerant check (Royalty) for each condition. The dotted lines indicates the total means under both flooding and control conditions. No adventitious root or survival reduction was observed in control condition.

