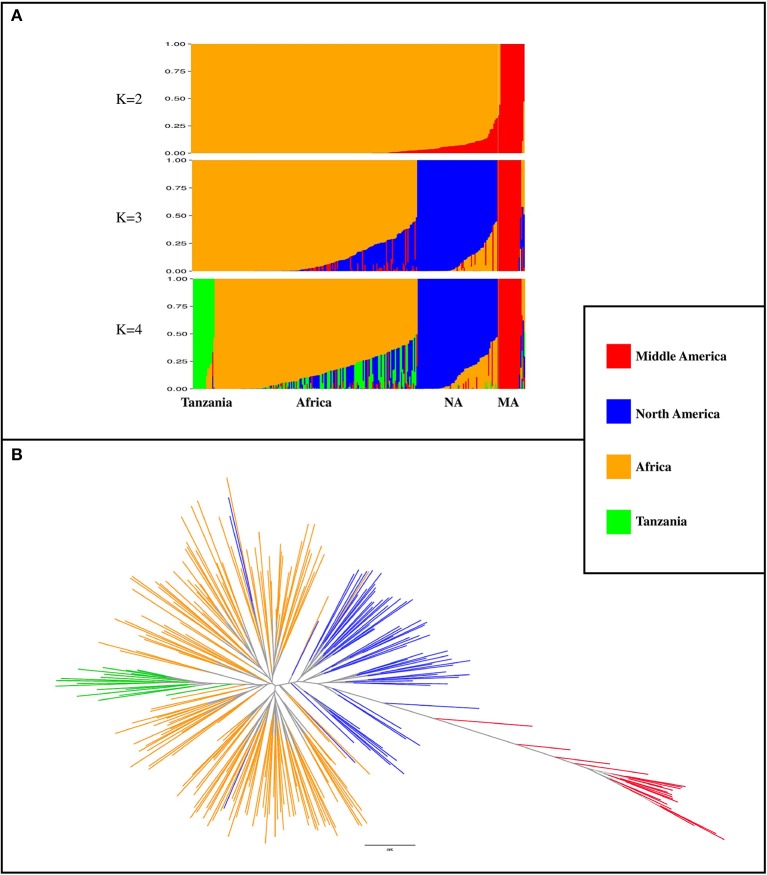
Figure 2.
Population classification using a subset of 3,668 markers that had LD r2 ≤ 0.1 (markers in linkage equilibrium). (A) Population structure from K = 2 to K = 4. K indicates the number of subpopulations. NA, North America; MA, Middle America (B) phylogenetic tree of genotypes, constructed by using SNPhylo. The colors of subpopulations were the same as population structure plot (K = 4).

