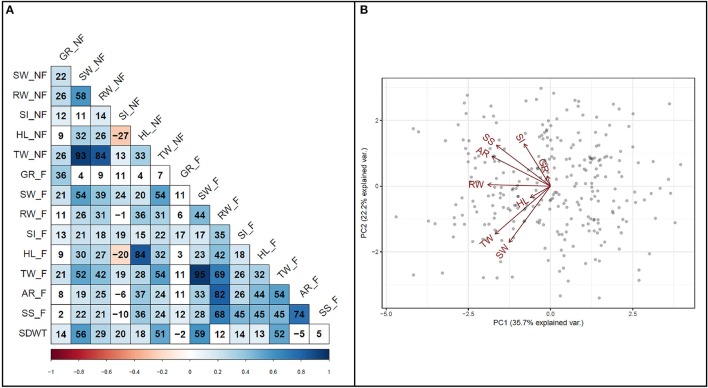
Figure 4.
Relationship among traits. (A) Pearson correlation coefficients among traits measured under flooded and non-flooded. Correlation coefficients multiplied by 100. (B) Biplot representing the relationship among different flooding indices used to separate genotypes. Traits evaluated in non-flooded and flooded conditions represented by _N and _F, respectively after the name of the trait. TW, total weight; SW, shoot weight; RW, root weight; HL, hypocotyl length; SI, SPAD index; GR, germination rate; AR, adventitious root formation; SS, survival score and SDWT, seed weight.

