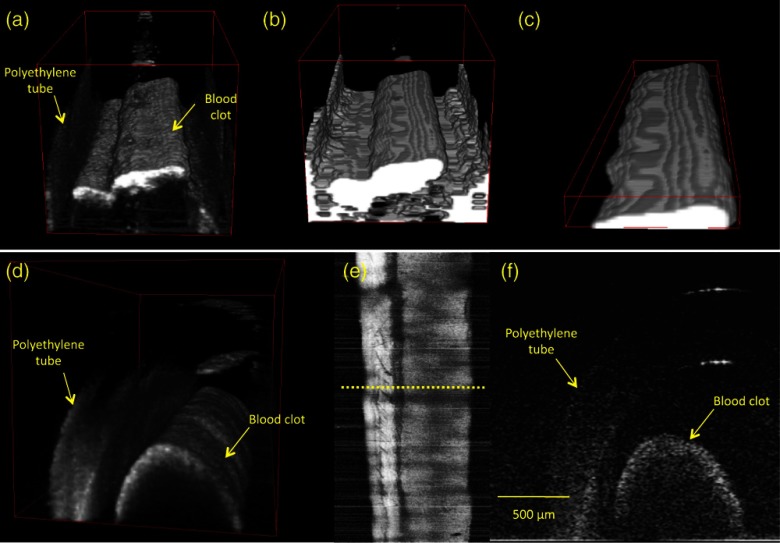
Fig. 2.
Example of blood clot volume derivation from an optical coherence tomography (OCT) scan and 3-D rendering of thrombus. A raw OCT image (a) was thresholded using the image’s mean intensity value to form a binary image (b) The portion of the image that demonstrated a clear boundary was then segmented (c) for volume assessment by pixel counting. A 3-D rendering of an OCT scan is shown (d) with a projected image [(e), top view], and a B-mode image [(f), cross-section] along the dotted yellow line in (e).

