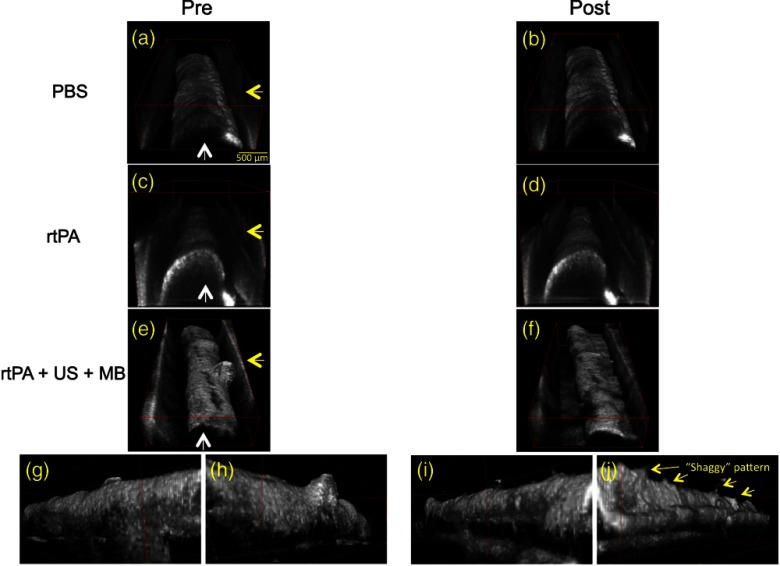
Fig. 4.
3-D optical coherence tomography (OCT) volume renderings. Pre- (left panels) and post-(right panels) treatment: control [(a) and (b)], recombinant tissue plasminogen activator [rt-PA, (c) and (d)], and ultrasound (US) + microbubbles (MB) + rt-PA [(e) and (f)]. The difference in pre- and post- volumes was most clear after US + MB + rt-PA treatment [(e) and (f)]; note the dissolution of the protuberance from the clot surface. Direction of flow is indicated with white arrows; transducer orientation is indicated with yellow arrows. Surface of clot shown in (e) facing away from (g) and toward (h) transducer before treatment. Surface of clot shown in (f) facing away from (i) and toward (j) transducer after treatment. The clot surface after treatment became shaggy, especially on the surface facing the transducer (j).

