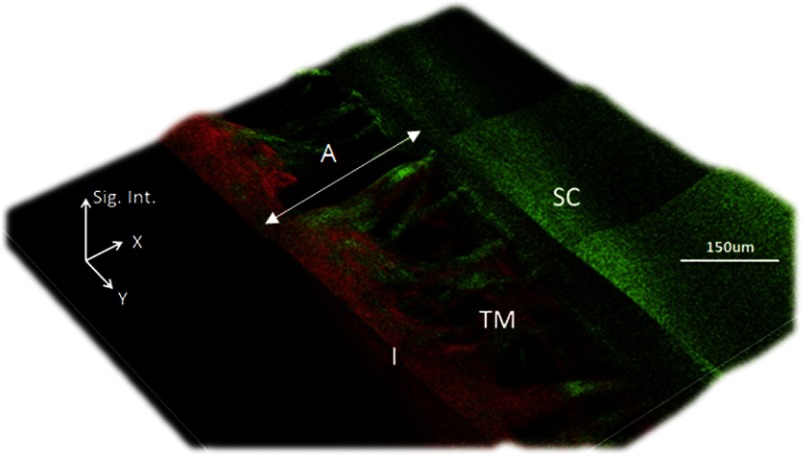
Fig. 3.
Processed 2.5D pseudo-intensity plot of MPM gonioscopy images. The two-dimensional image of Fig. 2(a) was processed by 2.5D to highlight regions between the collagen fibers lacking signal. The -axis of the processed 2.5D image is the signal intensity (Sig. Int.) of both the SHG and 2PAF signals (arbitrary units). The dark regions lacking both SHG and 2PAF are assumed to be fluid-filled pores.

