Fig. 3.
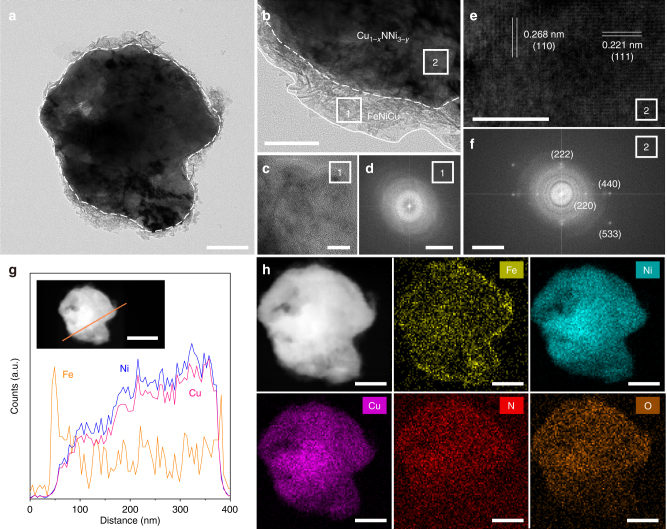
Morphology and texture characterization. a TEM and b magnified TEM images of p-Cu1−xNNi3−y/FeNiCu. c HRTEM and d the corresponding FFT images of the FeNiCu shell. e HRTEM and f the corresponding FFT images of the Cu1−xNNi3−y core. g Line-scan EDS spectra and h STEM-EDS element mapping images of the p-Cu1−xNNi3−y/FeNiCu. Scale bar in a is 100 nm, in b is 50 nm, in c is 10 nm, in d is 5 nm−1, in e is 5 nm, in f is 5 nm−1, in g is 200 nm and in h is 100 nm

