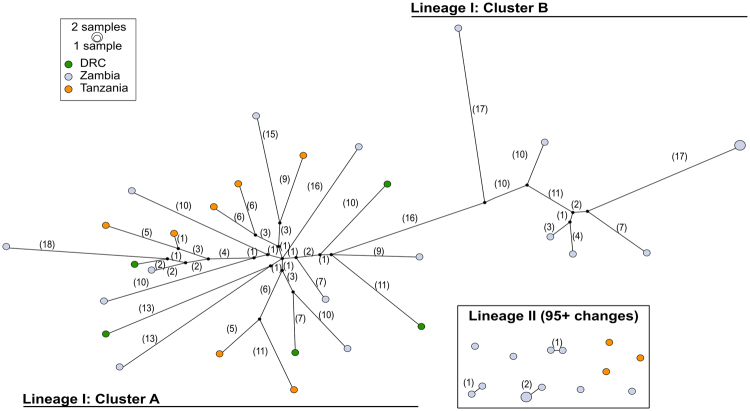
Figure 2.
Haplotype network of 43 An. funestus mitogenomes. In this TCS network, each node indicates a haplotype, with nodes colored according to origin. The number of mutational steps between nodes are indicated in parentheses beside the line connecting one node to another. One group of samples (all lineage II) did not connect to the main cluster within 95 mutational steps (over a 95% confidence limit for connectivity): these are shown in the box in the lower right. There are two distinct groups within the main cluster (lineage I): one more highly clustered (cluster A), and another with fewer, more-distant nodes (cluster B). Cluster A and B in lineage I are separated by ≥42 mutations. The size of each node indicates the number of samples sharing a specific haplotype.

