
Fig. 4.
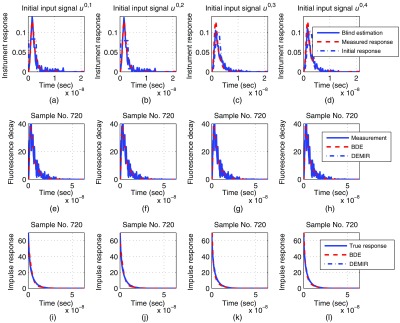
Synthetic evaluation at peak signal-to-noise ratio , where each column corresponds to the initial instrument response : (a)-(d) comparison for the instrument response estimation, (e)-(h) comparison for the fluorescence decay estimation at sample 720, (i)-(l) comparison for the fluorescence impulse response estimation at sample 720.