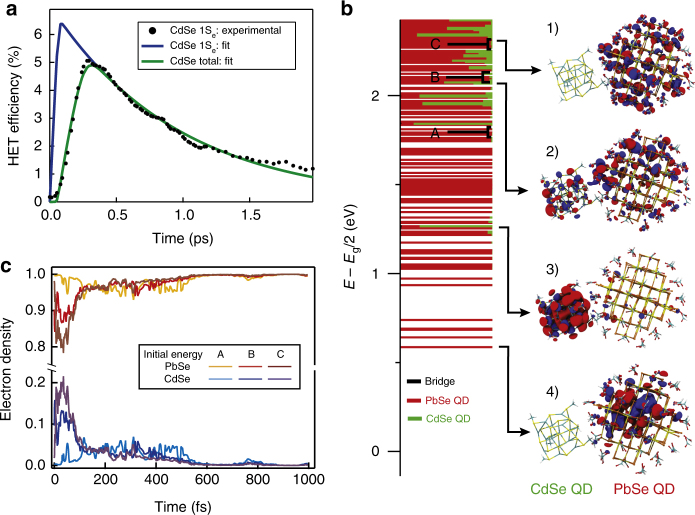
Fig. 5.
Modeling of hot-electron transfer. a Fit of the experimentally determined hot-electron transfer (HET) efficiency (black) with the rate-equation model discussed in the main text. The blue curve shows the fitted efficiency of charge injection in the CdSe 1Se level, while the green curve indicates the total fraction of electrons injected in any CdSe state. The TA measurement is performed exciting the HJ film with 650 nm laser light, with a fluence of 4.14 × 10¹² photons/(cm2 pulse). b, Computed electronic structure at the DFT/PBE level of theory of the PbSe-CdSe model system, which is composed of a PbSe QD and a CdSe QD coupled by a EDT molecule (bridge). The horizontal bars specify what fraction of each molecular orbital is localized on the PbSe QD (red), on the CdSe QD (green) and on the bridge (black). The contribution of the EDT bridge is almost negligible. The figure also shows the molecular orbital plots associated with 1) a high-energy state mostly localized on PbSe, 2) a high-energy state delocalized over both CdSe and PbSe, 3) the CdSe 1Se state, and 4) the PbSe 1Se state. c NAMD simulations illustrating the electron dynamics started from three different initial conditions indicated in (b) as A, B, and C. Electrons are rapidly injected into the CdSe QD, and transfer back on a longer timescale. The data show an increase in the maximum transferred electron density for initial states with higher energy

