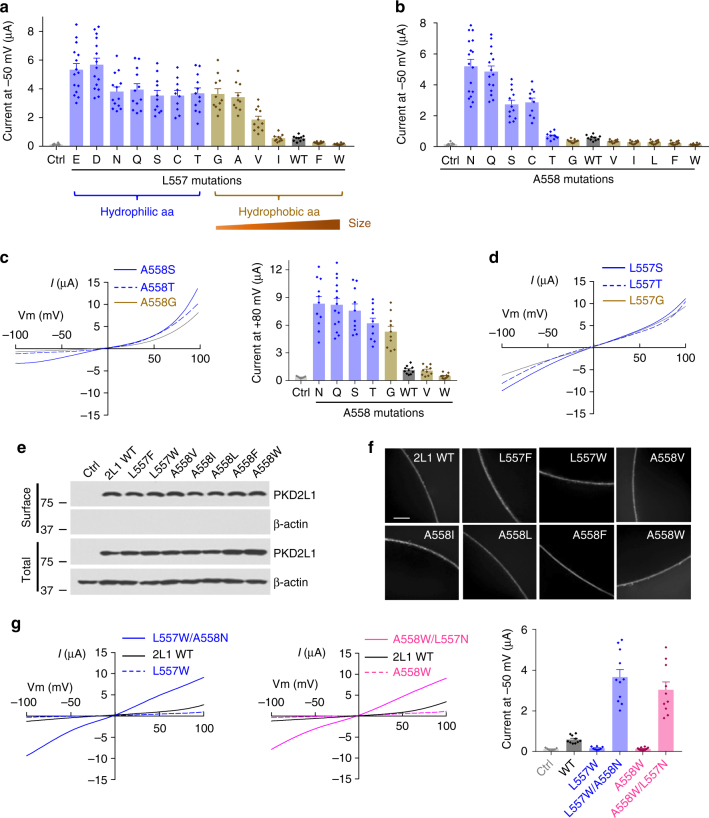
Fig. 2.
Characterization of mutants at PKD2L1 sites L557 and A558. a L557 was replaced with different aa, as indicated. Shown are averaged currents obtained under the same experimental conditions as in Fig. 1b (n = 10–15 oocytes from 3 batches). Data are presented as mean ± SEM. b A558 was replaced with different aa, as indicated, and averaged currents were obtained as in Fig. 1b (n = 10–17 oocytes from 3 batches). Data are presented as mean ± SEM. c Left panel, representative I–V curves for three indicated A558 mutants generated under the same experimental condition as in Fig. 1d. Right panel, averaged outward currents at +80 mV for indicated A558 mutants (n = 10–14). Data are presented as mean ± SEM. d Representative I–V curves for three indicated L557 mutants obtained as in Fig. 1d. e Western blot of surface biotinylated and total protein of PKD2L1 WT or indicated mutants. f Whole-mount immunofluorescence showing the oocyte surface expression of PKD2L1 WT or mutants from e. Scale bar, 50 μm. g L557 and A558 were replaced with W or N. Left panel, representative I–V curves of PKD2L1 WT or indicated mutants obtained as in Fig. 1d. Right panel, averaged current at −50 mV for PKD2L1 WT or indicated mutants (n = 8–11). Data are presented as mean ± SEM

