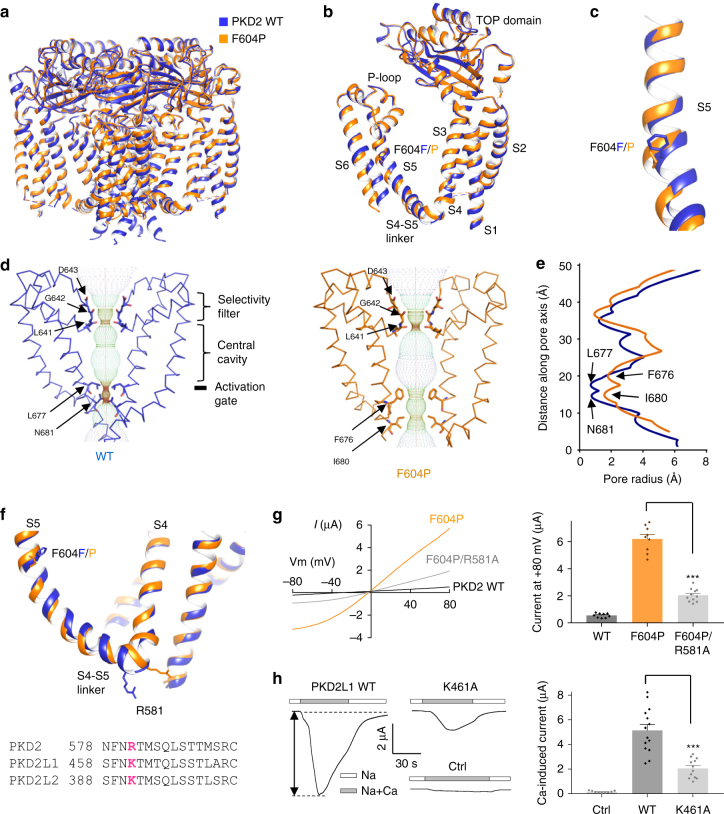
Fig. 5.
Comparison of structure of PKD2 F604P with that of WT channel. a, b Side view of superposition of tetrameric (a) and subunit (b) structures of PKD2 F604P (orange) and WT (blue). c Comparison between S5 helix in PKD2 F604P and WT channels. The F604 and P604 residues are shown. d Solvent-accessible pathway along the pore mapped using the HOLE program for PKD2 WT and F604P structures. Residues forming the selectivity filter and lower constriction points are indicated. e Comparison between the pore radii, calculated with the program HOLE, for the PKD2 WT and F604P structures. f Upper panel, comparison between the S4-S5 linker in the PKD2 WT and F604P structures. The R581 at the beginning of the linker is shown. Lower panel, sequence alignment of S4-S5 linker of human PKD2, PKD2L1 and PKD2L2. The conserved cationic residues were highlighted in bold and magenta. g Left panel, Representative I-V curves for PKD2 WT, single mutant F604P and double mutant F604P/R581A obtained under the same condition as in Fig. 3a. Right panel, averaged currents at +80 mV recorded from oocytes injected with cRNA of PKD2 WT or mutant F604P or F604P/R581A. Data are presented as mean ± SEM. ***P < 0.001 by Student’s t-test. h Left panel, representative whole-cell current traces obtained from control oocytes (Ctrl, water-injected) or oocytes injected with cRNA of human PKD2L1 WT or mutant K568A. Oocytes were voltage clamped at −50 mV and currents were recorded using Na-containing solution (see Fig. 1b) without (Na) or with addition of 5 mM CaCl2 (Na + Ca). The Ca-activated peak current, indicated by the double arrowed line, was measured to assess PKD2L1 channel activation. Right panel, averaged Ca-activated peak currents from oocytes expressing PKD2L1 WT or K461A mutant or water-injected oocytes (Ctrl). Data are presented as mean ± SEM. ***P < 0.001 by Student’s t-test

