Fig. 2.
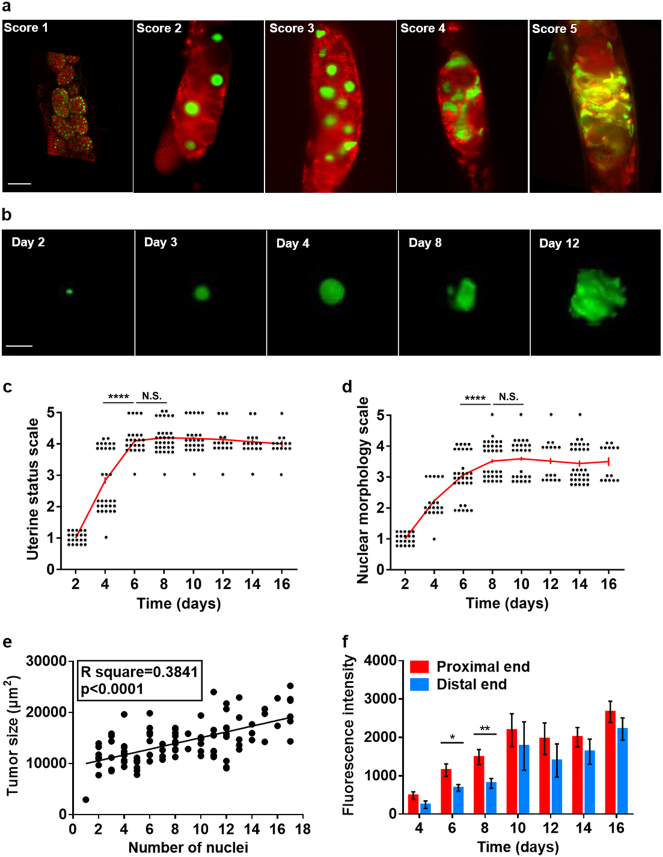
Further characterization of senescent uterine tumors. a Nuclear hypertrophy during tumor development (representative images of different animals). Scale bar, 25 μm. b Development of nuclear hypertrophy. Scale bar, 15 μm. c Uterine tumor development during aging. Uterine status scale: class 1, normal uterus containing eggs (day 1 adult). Class 2, slightly abnormal uterine contents, but no tumor visible. Class 3, small tumor. Class 4, medium sized tumor. Class 5, large tumor, filling body cavity and squashing the intestine. d Changes in nuclear morphology during tumor aging. Nuclear morphology scale (predominant morphology in tumor): class 1, normal sized, spherical nuclei. Class 2: moderately enlarged, spherical nuclei. Class 3: very large nuclei becoming non-spherical. Class 4: very large nuclei with frequent branching. Class 5: nuclei merged into large masses of chromatin. c, d day 0 is L4 stage; each point represents one tumor, and the same individuals were scored for each parameter; Wilcoxon–Mann Whitney test, ****p < 0.0001. e Linear regression analysis of number of oocyte nuclei and tumor size. f Nuclear hypertrophy is initially more marked in the proximal half of the tumor. Measured as HIS-58::GFP fluorescence intensity (mean ± s.e.m.); unpaired t-test, *p < 0.05; **p < 0.01. Sample sizes on each day: n = 9–24

