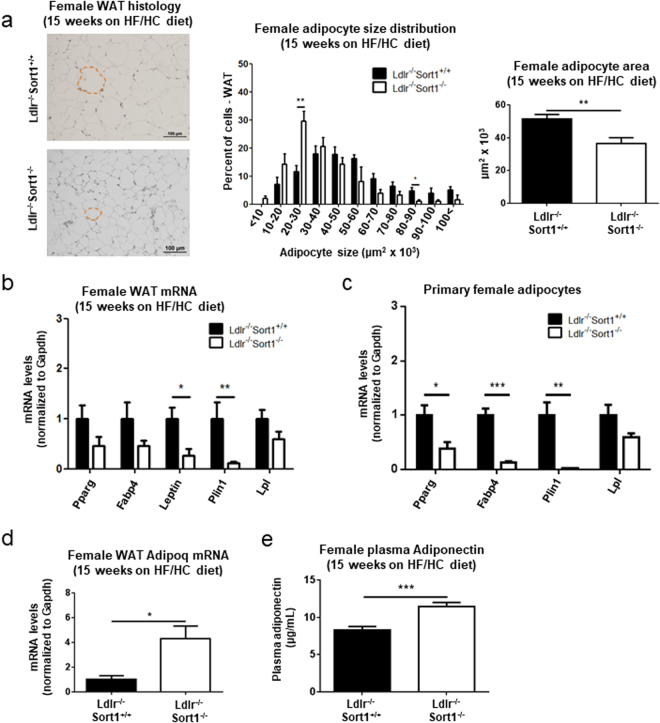
Figure 2.
Sort1 deficiency impaired WAT formation in female Ldlr−/− mice fed a HF/HC diet. (a) Representative hematoxylin and eosin stained sections (example of a white adipocyte outlined by dashed red line; scale bars indicate 100 μm), quantified adipocyte size distribution, and average size of white adipose tissue (WAT) adipocytes in female Ldlr−/−Sort1+/+ and Ldlr−/−Sort1−/− mice fed a high-fat/cholesterol (HF/HC) diet for 15 weeks; (n = 5–6 mice/group). (b) Female mice on a HF/HC diet for 15 weeks mRNA levels of genes related to white adipocyte formation in WAT, and in (c) primary white adipocytes differentiated from female mouse WAT; (n = 3–6 mice/group). (d) WAT Adipoq mRNA levels (n = 5–6 mice/group), and (e) plasma Adiponectin protein concentration in female Ldlr−/−Sort1+/+ and Ldlr−/−Sort1−/− mice fed a HF/HC diet for 15 weeks; (n = 10 mice/group). *P < 0.05, **P < 0.01, ***P < 0.001 versus Ldlr−/−Sort1+/+, analyzed by t-test; values are presented as mean ± SEM.

