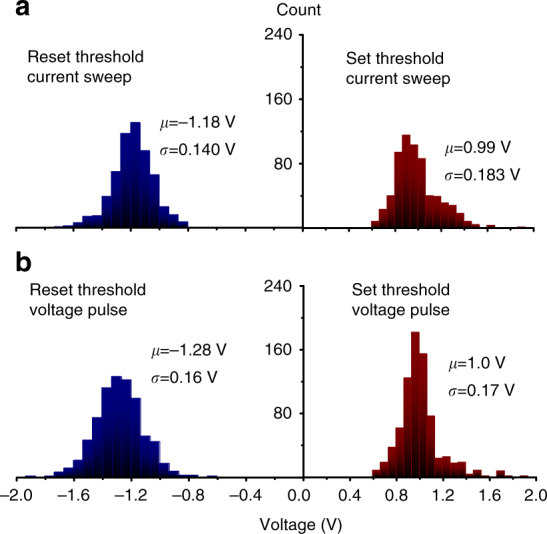
Fig. 2.

Set and reset threshold statistics. The data are shown for seven 20 × 20- device crossbar arrays at memristor switching with a current and b voltage pulses. The set/reset thresholds are defined as the smallest voltages at which the device resistance is increased/decreased by >5% at the application of a voltage or current pulse of the corresponding polarity. The legends show the corresponding averages and standard deviations for the switching threshold distributions. Note that the variations are naturally better when only considering devices within a single crossbar circuit, and in addition, excluding memristors at the edges of the circuit, which typically contribute to the long tails of the histograms. For example, excluding these devices, µ is 1.0 V/−1.2 V and σ is 0.13 V/0.15 V for voltage controlled set/reset for one of the crossbars used in the experiment
