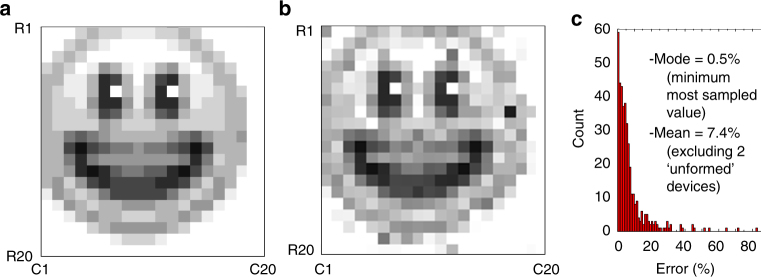
Fig. 3.
High precision tuning. a The desired “smiley face” pattern, quantized to 10 gray levels. b The actual resistance values measured after tuning all devices in 20 × 20 memristive crossbar with the nominal 5% accuracy, using the automated tuning algorithm48, and c the corresponding statistics of the tuning errors, which is defined as normalized absolute difference between the target and actual conductance values. On panel a, the white/black pixels correspond to 96.6 KΩ/7 KΩ, measured at 0.2 V bias. The tuning was performed with 500-µs-long voltage pulses with amplitudes in a [0.8 V, 1.5 V]/[−1.8 V, −0.8 V] range to increase/decrease device conductance. (Supplementary Fig. 3 shows absolute values of resistances and absolute error for the data on panels b and c, respectively)

