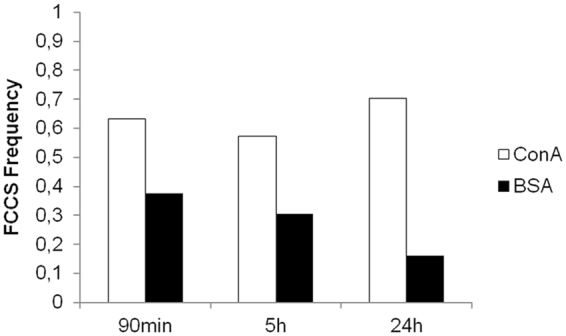
Figure 5.

FCCS occurrence at each time-point for measurements performed in cells incubated with NPs with a pre-formed ConA PC and BSA PC and normalized for the total number of measurements. 30, 28, 27 areas were sampled in up to 5 cells exposed to NPs with preformed ConA PC after 90 minutes, and at 5 hours and at 24 hours of incubation, respectively. In the case of NPs associated to BSA, the number of sampled areas was 24, 23, and 31 at 90 minutes, 5 hours and 24 hours of incubation, respectively. Significant differences between ConA PC NPs and BSA PC NPs (Fisher exact test P = 0.0123, P < 0.05).
