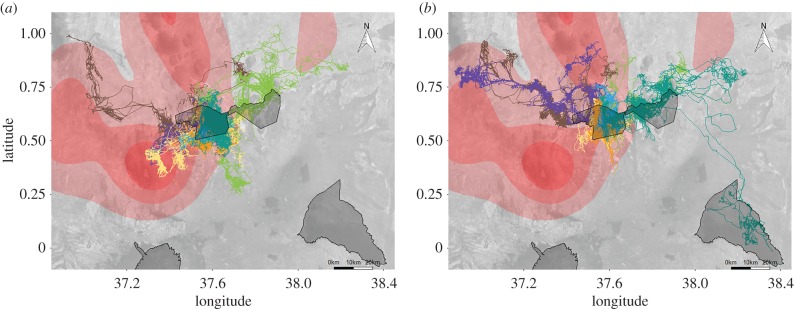
Figure 1.
Movement tracks plotted from earlier (a) and later (b) generations from seven groups collared between 2001 and 2017 (data from groups where only one generation was tracked are not shown). Lines represent 20 (a) and 18 (b) tracked years on a Google Maps base map. Outlines demarcate national reserves and parks, with the two central outlines demarcating the Samburu and Buffalo Springs (left) and Shaba (right) National Reserves complex. Underlying red contours represent poached carcass density during the period when the later generation was tracked (2013–2017). Carcass data were not available for the ecosystem encompassing Meru National Park in the southeast corner.

