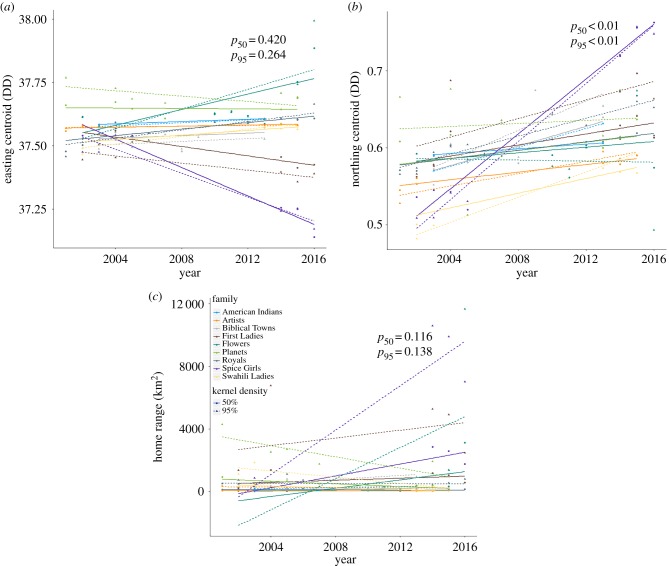
Figure 2.
Easting (a) and northing (b) range centroids and home range size (c) across the years of the study for 95% and 50% home ranges. Ranges shifted north over the study across the sample and increased in size for about half of the studied groups. Longitudinal shifts were mixed among families. Distinct colours correspond to different core groups and are consistent across panels and with figure 1.

