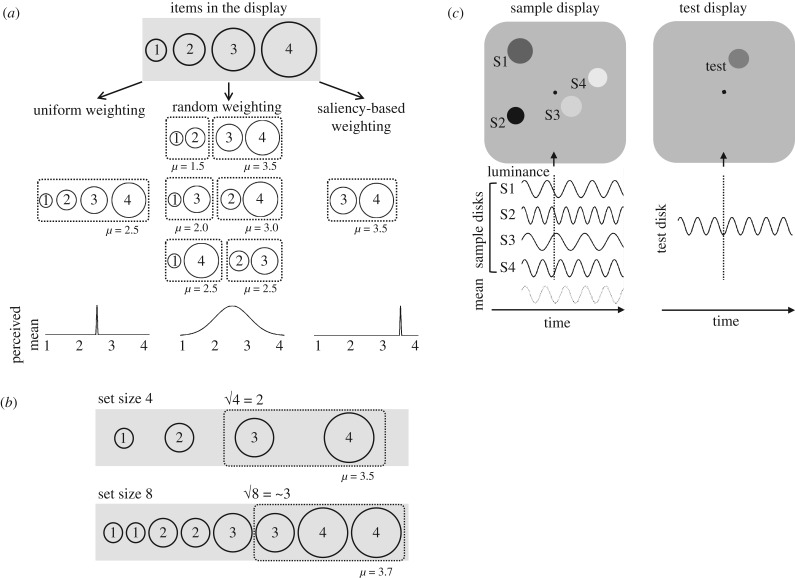
Figure 1.
(a) Schematic predictions for the perceived mean values based on the three hypotheses. Dotted lines enclose a part of items (theoretically √N of the set size) weighted more than others. (b) An illustration of an increase in the perceived mean value according to the set size under the saliency-based weighting hypothesis. (c) Examples of the sample display and the subsequent test display in experiment 1 under one of the subset conditions (number of items presented = 4). Four sinusoidal waves in solid lines represent luminance modulations over time for the sample discs, and a dotted line at the bottom waves at the mean TF of them. The luminance of discs in the picture varies as they are in different phases of the sinusoidal waves (a vertical dotted line indicates the moment shown in the picture).

